Coccidioides posadasii (strain RMSCC 757 / Silveira) (Valley fever fungus)
Taxonomy: cellular organisms; Eukaryota; Opisthokonta; Fungi; Dikarya; Ascomycota; saccharomyceta; Pezizomycotina; leotiomyceta; Eurotiomycetes; Eurotiomycetidae; Onygenales; Onygenales incertae sedis; Coccidioides; Coccidioides posadasii
Average proteome isoelectric point is 7.07
Get precalculated fractions of proteins

Virtual 2D-PAGE plot for 10212 proteins (isoelectric point calculated using IPC2_protein)
Get csv file with sequences according to given criteria:
* You can choose from 21 different methods for calculating isoelectric point
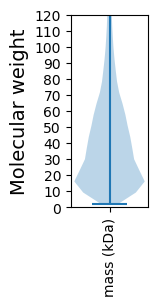
Summary statistics related to proteome-wise predictions


Protein with the lowest isoelectric point:
>tr|E9CTF7|E9CTF7_COCPS Predicted protein OS=Coccidioides posadasii (strain RMSCC 757 / Silveira) OX=443226 GN=CPSG_00848 PE=4 SV=1
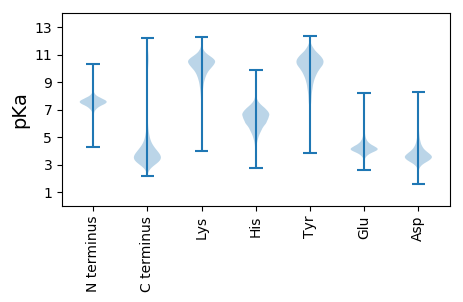
MM1 pKa = 7.76ASIQTRR7 pKa = 11.84TDD9 pKa = 3.14VAPTGTSAVTSAVPTACGATTYY31 pKa = 10.2DD32 pKa = 4.32IPTKK36 pKa = 10.53DD37 pKa = 3.26AACAVPGTEE46 pKa = 5.17HH47 pKa = 7.14KK48 pKa = 10.98DD49 pKa = 3.73SMEE52 pKa = 4.27KK53 pKa = 10.76CCDD56 pKa = 3.65APVVTYY62 pKa = 11.16NEE64 pKa = 4.46GCGMYY69 pKa = 10.13CLASGGTVGDD79 pKa = 4.12LVKK82 pKa = 10.84CLIGDD87 pKa = 4.79GIADD91 pKa = 3.57GKK93 pKa = 9.37VFCNKK98 pKa = 8.87EE99 pKa = 3.83MNATATTTPTPTGRR113 pKa = 11.84DD114 pKa = 3.53DD115 pKa = 6.59DD116 pKa = 5.66DD117 pKa = 5.7DD118 pKa = 6.8HH119 pKa = 9.25DD120 pKa = 6.63DD121 pKa = 5.97DD122 pKa = 7.11DD123 pKa = 6.29DD124 pKa = 4.68EE125 pKa = 4.58PTNTDD130 pKa = 3.0GSPASTSSSAALANLPPQTLSKK152 pKa = 10.03PAIGVLFTLFFSTFAGVVFAA172 pKa = 6.13
MM1 pKa = 7.76ASIQTRR7 pKa = 11.84TDD9 pKa = 3.14VAPTGTSAVTSAVPTACGATTYY31 pKa = 10.2DD32 pKa = 4.32IPTKK36 pKa = 10.53DD37 pKa = 3.26AACAVPGTEE46 pKa = 5.17HH47 pKa = 7.14KK48 pKa = 10.98DD49 pKa = 3.73SMEE52 pKa = 4.27KK53 pKa = 10.76CCDD56 pKa = 3.65APVVTYY62 pKa = 11.16NEE64 pKa = 4.46GCGMYY69 pKa = 10.13CLASGGTVGDD79 pKa = 4.12LVKK82 pKa = 10.84CLIGDD87 pKa = 4.79GIADD91 pKa = 3.57GKK93 pKa = 9.37VFCNKK98 pKa = 8.87EE99 pKa = 3.83MNATATTTPTPTGRR113 pKa = 11.84DD114 pKa = 3.53DD115 pKa = 6.59DD116 pKa = 5.66DD117 pKa = 5.7DD118 pKa = 6.8HH119 pKa = 9.25DD120 pKa = 6.63DD121 pKa = 5.97DD122 pKa = 7.11DD123 pKa = 6.29DD124 pKa = 4.68EE125 pKa = 4.58PTNTDD130 pKa = 3.0GSPASTSSSAALANLPPQTLSKK152 pKa = 10.03PAIGVLFTLFFSTFAGVVFAA172 pKa = 6.13
Molecular weight: 17.53 kDa
Isoelectric point according different methods:
Protein with the highest isoelectric point:
>tr|E9DGH1|E9DGH1_COCPS Uncharacterized protein OS=Coccidioides posadasii (strain RMSCC 757 / Silveira) OX=443226 GN=CPSG_08920 PE=4 SV=1
MM1 pKa = 7.67RR2 pKa = 11.84SKK4 pKa = 9.75MCHH7 pKa = 4.7QRR9 pKa = 11.84HH10 pKa = 5.81FPRR13 pKa = 11.84TAALMPSASAHH24 pKa = 5.79LRR26 pKa = 11.84LSLKK30 pKa = 10.16QSPAAWLRR38 pKa = 11.84TARR41 pKa = 11.84RR42 pKa = 11.84QNSKK46 pKa = 10.82NPFVTQIKK54 pKa = 10.26SVVLLASPISRR65 pKa = 11.84RR66 pKa = 11.84APSAQPEE73 pKa = 4.52LPSQAAAAALRR84 pKa = 11.84PQPTPLLRR92 pKa = 11.84PQAAPRR98 pKa = 11.84ALALPHH104 pKa = 6.33PQALHH109 pKa = 5.34PTPTRR114 pKa = 11.84ILQATTLLKK123 pKa = 10.22PRR125 pKa = 11.84PPLPTGLRR133 pKa = 11.84LLLAMPMVVPSLPSPLL149 pKa = 3.76
MM1 pKa = 7.67RR2 pKa = 11.84SKK4 pKa = 9.75MCHH7 pKa = 4.7QRR9 pKa = 11.84HH10 pKa = 5.81FPRR13 pKa = 11.84TAALMPSASAHH24 pKa = 5.79LRR26 pKa = 11.84LSLKK30 pKa = 10.16QSPAAWLRR38 pKa = 11.84TARR41 pKa = 11.84RR42 pKa = 11.84QNSKK46 pKa = 10.82NPFVTQIKK54 pKa = 10.26SVVLLASPISRR65 pKa = 11.84RR66 pKa = 11.84APSAQPEE73 pKa = 4.52LPSQAAAAALRR84 pKa = 11.84PQPTPLLRR92 pKa = 11.84PQAAPRR98 pKa = 11.84ALALPHH104 pKa = 6.33PQALHH109 pKa = 5.34PTPTRR114 pKa = 11.84ILQATTLLKK123 pKa = 10.22PRR125 pKa = 11.84PPLPTGLRR133 pKa = 11.84LLLAMPMVVPSLPSPLL149 pKa = 3.76
Molecular weight: 16.21 kDa
Isoelectric point according different methods:
Peptides (in silico digests for buttom-up proteomics)
Below you can find in silico digests of the whole proteome with Trypsin, Chymotrypsin, Trypsin+LysC, LysN, ArgC proteases suitable for different mass spec machines.| Try ESI |
 |
|---|
| ChTry ESI |
 |
|---|
| ArgC ESI |
 |
|---|
| LysN ESI |
 |
|---|
| TryLysC ESI |
 |
|---|
| Try MALDI |
 |
|---|
| ChTry MALDI |
 |
|---|
| ArgC MALDI |
 |
|---|
| LysN MALDI |
 |
|---|
| TryLysC MALDI |
 |
|---|
| Try LTQ |
 |
|---|
| ChTry LTQ |
 |
|---|
| ArgC LTQ |
 |
|---|
| LysN LTQ |
 |
|---|
| TryLysC LTQ |
 |
|---|
| Try MSlow |
 |
|---|
| ChTry MSlow |
 |
|---|
| ArgC MSlow |
 |
|---|
| LysN MSlow |
 |
|---|
| TryLysC MSlow |
 |
|---|
| Try MShigh |
 |
|---|
| ChTry MShigh |
 |
|---|
| ArgC MShigh |
 |
|---|
| LysN MShigh |
 |
|---|
| TryLysC MShigh |
 |
|---|
General Statistics
Number of major isoforms |
Number of additional isoforms |
Number of all proteins |
Number of amino acids |
Min. Seq. Length |
Max. Seq. Length |
Avg. Seq. Length |
Avg. Mol. Weight |
|---|---|---|---|---|---|---|---|
4174551 |
17 |
6196 |
408.8 |
45.44 |
Amino acid frequency
Ala |
Cys |
Asp |
Glu |
Phe |
Gly |
His |
Ile |
Lys |
Leu |
|---|---|---|---|---|---|---|---|---|---|
8.0 ± 0.022 | 1.345 ± 0.01 |
5.483 ± 0.016 | 6.253 ± 0.028 |
3.726 ± 0.015 | 6.602 ± 0.022 |
2.472 ± 0.013 | 5.073 ± 0.018 |
5.075 ± 0.021 | 8.97 ± 0.03 |
Met |
Asn |
Gln |
Pro |
Arg |
Ser |
Thr |
Val |
Trp |
Tyr |
|---|---|---|---|---|---|---|---|---|---|
2.148 ± 0.009 | 3.748 ± 0.011 |
6.276 ± 0.03 | 4.032 ± 0.017 |
6.593 ± 0.023 | 8.635 ± 0.031 |
5.681 ± 0.014 | 5.844 ± 0.016 |
1.377 ± 0.008 | 2.666 ± 0.012 |
Most of the basic statistics you can see at this page can be downloaded from this CSV file
Proteome-pI is available under Creative Commons Attribution-NoDerivs license, for more details see here
| Reference: Kozlowski LP. Proteome-pI 2.0: Proteome Isoelectric Point Database Update. Nucleic Acids Res. 2021, doi: 10.1093/nar/gkab944 | Contact: Lukasz P. Kozlowski |
