Prevotella melaninogenica (strain ATCC 25845 / DSM 7089 / JCM 6325 / VPI 2381 / B282) (Bacteroides melaninogenicus)
Taxonomy: cellular organisms; Bacteria; FCB group; Bacteroidetes/Chlorobi group; Bacteroidetes; Bacteroidia; Bacteroidales; Prevotellaceae; Prevotella; Prevotella melaninogenica
Average proteome isoelectric point is 6.66
Get precalculated fractions of proteins

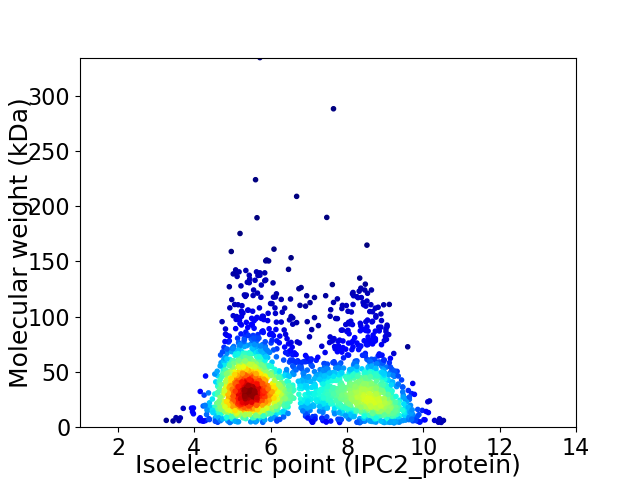
Virtual 2D-PAGE plot for 2288 proteins (isoelectric point calculated using IPC2_protein)
Get csv file with sequences according to given criteria:
* You can choose from 21 different methods for calculating isoelectric point
Summary statistics related to proteome-wise predictions


Protein with the lowest isoelectric point:
>tr|D9RTK6|D9RTK6_PREMB 30S ribosomal protein S10 OS=Prevotella melaninogenica (strain ATCC 25845 / DSM 7089 / JCM 6325 / VPI 2381 / B282) OX=553174 GN=rpsJ PE=3 SV=1
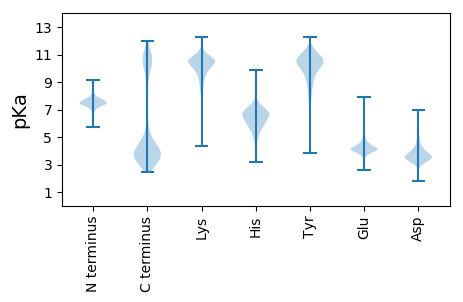
MM1 pKa = 7.92KK2 pKa = 10.69YY3 pKa = 10.22QITCDD8 pKa = 3.14NCGTQFIVEE17 pKa = 4.22AEE19 pKa = 3.99EE20 pKa = 4.55GQTIEE25 pKa = 4.62CTCPHH30 pKa = 6.43CHH32 pKa = 5.73GVMEE36 pKa = 4.37VTLPLVSAGQQYY48 pKa = 7.41EE49 pKa = 4.12QPTGFTSQAQQVQGEE64 pKa = 4.44THH66 pKa = 6.77KK67 pKa = 10.83KK68 pKa = 10.07DD69 pKa = 3.38SNAILWGVVIGLLLLAGGVGAYY91 pKa = 7.39FTFGSSSPEE100 pKa = 3.95TPVTDD105 pKa = 5.17SIPNDD110 pKa = 3.9TIPYY114 pKa = 7.19EE115 pKa = 4.2SPIQVEE121 pKa = 4.16QTPSVDD127 pKa = 3.66TVATAPAEE135 pKa = 4.13PEE137 pKa = 4.06QKK139 pKa = 10.39EE140 pKa = 4.17EE141 pKa = 4.2EE142 pKa = 4.35QVEE145 pKa = 4.23EE146 pKa = 4.17QPEE149 pKa = 4.09EE150 pKa = 4.18GADD153 pKa = 3.76TIAVPGHH160 pKa = 6.98DD161 pKa = 3.62EE162 pKa = 3.81
MM1 pKa = 7.92KK2 pKa = 10.69YY3 pKa = 10.22QITCDD8 pKa = 3.14NCGTQFIVEE17 pKa = 4.22AEE19 pKa = 3.99EE20 pKa = 4.55GQTIEE25 pKa = 4.62CTCPHH30 pKa = 6.43CHH32 pKa = 5.73GVMEE36 pKa = 4.37VTLPLVSAGQQYY48 pKa = 7.41EE49 pKa = 4.12QPTGFTSQAQQVQGEE64 pKa = 4.44THH66 pKa = 6.77KK67 pKa = 10.83KK68 pKa = 10.07DD69 pKa = 3.38SNAILWGVVIGLLLLAGGVGAYY91 pKa = 7.39FTFGSSSPEE100 pKa = 3.95TPVTDD105 pKa = 5.17SIPNDD110 pKa = 3.9TIPYY114 pKa = 7.19EE115 pKa = 4.2SPIQVEE121 pKa = 4.16QTPSVDD127 pKa = 3.66TVATAPAEE135 pKa = 4.13PEE137 pKa = 4.06QKK139 pKa = 10.39EE140 pKa = 4.17EE141 pKa = 4.2EE142 pKa = 4.35QVEE145 pKa = 4.23EE146 pKa = 4.17QPEE149 pKa = 4.09EE150 pKa = 4.18GADD153 pKa = 3.76TIAVPGHH160 pKa = 6.98DD161 pKa = 3.62EE162 pKa = 3.81
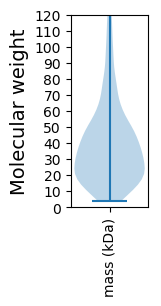
Molecular weight: 17.38 kDa
Isoelectric point according different methods:
Protein with the highest isoelectric point:
>tr|D9RWJ4|D9RWJ4_PREMB Abi-like protein OS=Prevotella melaninogenica (strain ATCC 25845 / DSM 7089 / JCM 6325 / VPI 2381 / B282) OX=553174 GN=HMPREF0659_A7033 PE=4 SV=1
MM1 pKa = 8.27RR2 pKa = 11.84YY3 pKa = 9.78RR4 pKa = 11.84YY5 pKa = 8.36TEE7 pKa = 4.34GGDD10 pKa = 3.03VRR12 pKa = 11.84YY13 pKa = 9.03FFKK16 pKa = 10.9SIVIATKK23 pKa = 10.14CNRR26 pKa = 11.84LRR28 pKa = 11.84VSGMRR33 pKa = 11.84NDD35 pKa = 3.56EE36 pKa = 3.91VLGRR40 pKa = 11.84LNRR43 pKa = 11.84FKK45 pKa = 11.29DD46 pKa = 3.59NLIMSSCLNPKK57 pKa = 9.37NRR59 pKa = 11.84QLL61 pKa = 3.69
MM1 pKa = 8.27RR2 pKa = 11.84YY3 pKa = 9.78RR4 pKa = 11.84YY5 pKa = 8.36TEE7 pKa = 4.34GGDD10 pKa = 3.03VRR12 pKa = 11.84YY13 pKa = 9.03FFKK16 pKa = 10.9SIVIATKK23 pKa = 10.14CNRR26 pKa = 11.84LRR28 pKa = 11.84VSGMRR33 pKa = 11.84NDD35 pKa = 3.56EE36 pKa = 3.91VLGRR40 pKa = 11.84LNRR43 pKa = 11.84FKK45 pKa = 11.29DD46 pKa = 3.59NLIMSSCLNPKK57 pKa = 9.37NRR59 pKa = 11.84QLL61 pKa = 3.69
Molecular weight: 7.25 kDa
Isoelectric point according different methods:
Peptides (in silico digests for buttom-up proteomics)
Below you can find in silico digests of the whole proteome with Trypsin, Chymotrypsin, Trypsin+LysC, LysN, ArgC proteases suitable for different mass spec machines.| Try ESI |
 |
|---|
| ChTry ESI |
 |
|---|
| ArgC ESI |
 |
|---|
| LysN ESI |
 |
|---|
| TryLysC ESI |
 |
|---|
| Try MALDI |
 |
|---|
| ChTry MALDI |
 |
|---|
| ArgC MALDI |
 |
|---|
| LysN MALDI |
 |
|---|
| TryLysC MALDI |
 |
|---|
| Try LTQ |
 |
|---|
| ChTry LTQ |
 |
|---|
| ArgC LTQ |
 |
|---|
| LysN LTQ |
 |
|---|
| TryLysC LTQ |
 |
|---|
| Try MSlow |
 |
|---|
| ChTry MSlow |
 |
|---|
| ArgC MSlow |
 |
|---|
| LysN MSlow |
 |
|---|
| TryLysC MSlow |
 |
|---|
| Try MShigh |
 |
|---|
| ChTry MShigh |
 |
|---|
| ArgC MShigh |
 |
|---|
| LysN MShigh |
 |
|---|
| TryLysC MShigh |
 |
|---|
General Statistics
Number of major isoforms |
Number of additional isoforms |
Number of all proteins |
Number of amino acids |
Min. Seq. Length |
Max. Seq. Length |
Avg. Seq. Length |
Avg. Mol. Weight |
|---|---|---|---|---|---|---|---|
0 |
839578 |
37 |
3011 |
366.9 |
41.41 |
Amino acid frequency
Ala |
Cys |
Asp |
Glu |
Phe |
Gly |
His |
Ile |
Lys |
Leu |
|---|---|---|---|---|---|---|---|---|---|
7.168 ± 0.05 | 1.145 ± 0.018 |
5.76 ± 0.034 | 6.236 ± 0.053 |
4.448 ± 0.031 | 6.731 ± 0.049 |
2.012 ± 0.02 | 6.722 ± 0.05 |
6.937 ± 0.041 | 8.949 ± 0.047 |
Met |
Asn |
Gln |
Pro |
Arg |
Ser |
Thr |
Val |
Trp |
Tyr |
|---|---|---|---|---|---|---|---|---|---|
2.725 ± 0.024 | 5.277 ± 0.041 |
3.595 ± 0.022 | 3.69 ± 0.031 |
4.624 ± 0.039 | 6.121 ± 0.043 |
5.745 ± 0.043 | 6.488 ± 0.037 |
1.213 ± 0.019 | 4.412 ± 0.035 |
Most of the basic statistics you can see at this page can be downloaded from this CSV file
Proteome-pI is available under Creative Commons Attribution-NoDerivs license, for more details see here
| Reference: Kozlowski LP. Proteome-pI 2.0: Proteome Isoelectric Point Database Update. Nucleic Acids Res. 2021, doi: 10.1093/nar/gkab944 | Contact: Lukasz P. Kozlowski |
