Erythrobacter sp. SD-21
Taxonomy: cellular organisms; Bacteria; Proteobacteria; Alphaproteobacteria; Sphingomonadales; Erythrobacteraceae; Erythrobacter/Porphyrobacter group; Erythrobacter; unclassified Erythrobacter
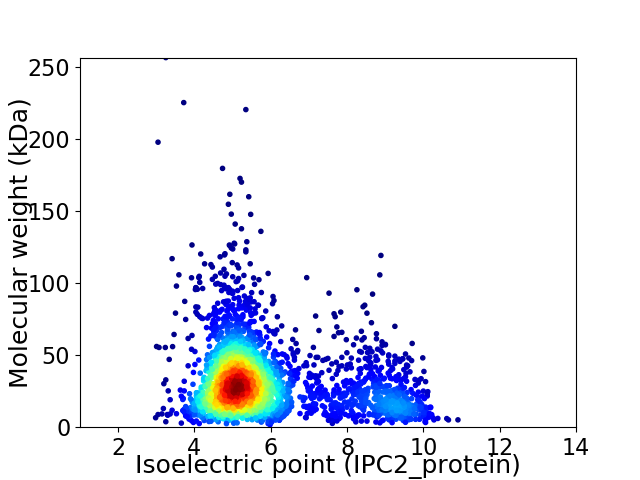
Average proteome isoelectric point is 5.93
Get precalculated fractions of proteins

Virtual 2D-PAGE plot for 2938 proteins (isoelectric point calculated using IPC2_protein)
Get csv file with sequences according to given criteria:
* You can choose from 21 different methods for calculating isoelectric point
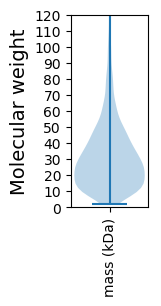
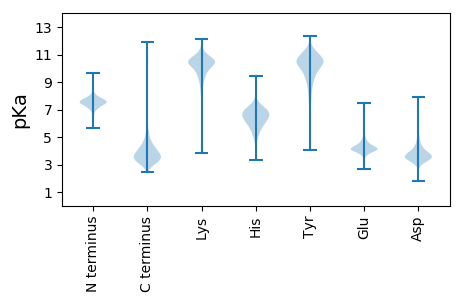
Summary statistics related to proteome-wise predictions


Protein with the lowest isoelectric point:
>tr|A5P742|A5P742_9SPHN Transcription elongation factor GreB OS=Erythrobacter sp. SD-21 OX=161528 GN=greB PE=3 SV=1
MM1 pKa = 7.28AQDD4 pKa = 3.83SDD6 pKa = 3.88NFDD9 pKa = 3.54GFRR12 pKa = 11.84IEE14 pKa = 5.27ALAGYY19 pKa = 9.22DD20 pKa = 3.47VSKK23 pKa = 11.15AGSTSDD29 pKa = 3.73NDD31 pKa = 3.63TNANDD36 pKa = 3.88DD37 pKa = 3.52QSIDD41 pKa = 3.27GLAYY45 pKa = 10.21GVGAGYY51 pKa = 10.72DD52 pKa = 3.66FDD54 pKa = 6.0AGGVVLGLEE63 pKa = 4.11AEE65 pKa = 4.72YY66 pKa = 11.05VGSTAEE72 pKa = 4.05TEE74 pKa = 3.9YY75 pKa = 11.66DD76 pKa = 3.13MGDD79 pKa = 3.48FEE81 pKa = 7.0DD82 pKa = 3.74IGVGNVEE89 pKa = 4.36TGRR92 pKa = 11.84DD93 pKa = 3.62LYY95 pKa = 11.26LGARR99 pKa = 11.84VGVKK103 pKa = 10.59ANDD106 pKa = 3.85DD107 pKa = 3.87LLVYY111 pKa = 10.91AKK113 pKa = 10.47GGYY116 pKa = 8.23TNATYY121 pKa = 11.09NFRR124 pKa = 11.84NNDD127 pKa = 3.02GTNEE131 pKa = 4.05YY132 pKa = 10.39EE133 pKa = 4.35VDD135 pKa = 3.8LDD137 pKa = 3.7TDD139 pKa = 3.96GFRR142 pKa = 11.84VGGGLEE148 pKa = 4.04YY149 pKa = 10.84ALSGNTFAKK158 pKa = 10.36VEE160 pKa = 4.03YY161 pKa = 9.72RR162 pKa = 11.84YY163 pKa = 11.06SNYY166 pKa = 10.23SDD168 pKa = 4.95AEE170 pKa = 4.09LDD172 pKa = 4.04FEE174 pKa = 6.04GDD176 pKa = 3.7APDD179 pKa = 3.79VAVPDD184 pKa = 3.7IDD186 pKa = 4.79LDD188 pKa = 3.71RR189 pKa = 11.84HH190 pKa = 4.31QVMAGFGMRR199 pKa = 11.84FF200 pKa = 3.14
MM1 pKa = 7.28AQDD4 pKa = 3.83SDD6 pKa = 3.88NFDD9 pKa = 3.54GFRR12 pKa = 11.84IEE14 pKa = 5.27ALAGYY19 pKa = 9.22DD20 pKa = 3.47VSKK23 pKa = 11.15AGSTSDD29 pKa = 3.73NDD31 pKa = 3.63TNANDD36 pKa = 3.88DD37 pKa = 3.52QSIDD41 pKa = 3.27GLAYY45 pKa = 10.21GVGAGYY51 pKa = 10.72DD52 pKa = 3.66FDD54 pKa = 6.0AGGVVLGLEE63 pKa = 4.11AEE65 pKa = 4.72YY66 pKa = 11.05VGSTAEE72 pKa = 4.05TEE74 pKa = 3.9YY75 pKa = 11.66DD76 pKa = 3.13MGDD79 pKa = 3.48FEE81 pKa = 7.0DD82 pKa = 3.74IGVGNVEE89 pKa = 4.36TGRR92 pKa = 11.84DD93 pKa = 3.62LYY95 pKa = 11.26LGARR99 pKa = 11.84VGVKK103 pKa = 10.59ANDD106 pKa = 3.85DD107 pKa = 3.87LLVYY111 pKa = 10.91AKK113 pKa = 10.47GGYY116 pKa = 8.23TNATYY121 pKa = 11.09NFRR124 pKa = 11.84NNDD127 pKa = 3.02GTNEE131 pKa = 4.05YY132 pKa = 10.39EE133 pKa = 4.35VDD135 pKa = 3.8LDD137 pKa = 3.7TDD139 pKa = 3.96GFRR142 pKa = 11.84VGGGLEE148 pKa = 4.04YY149 pKa = 10.84ALSGNTFAKK158 pKa = 10.36VEE160 pKa = 4.03YY161 pKa = 9.72RR162 pKa = 11.84YY163 pKa = 11.06SNYY166 pKa = 10.23SDD168 pKa = 4.95AEE170 pKa = 4.09LDD172 pKa = 4.04FEE174 pKa = 6.04GDD176 pKa = 3.7APDD179 pKa = 3.79VAVPDD184 pKa = 3.7IDD186 pKa = 4.79LDD188 pKa = 3.71RR189 pKa = 11.84HH190 pKa = 4.31QVMAGFGMRR199 pKa = 11.84FF200 pKa = 3.14
Molecular weight: 21.48 kDa
Isoelectric point according different methods:
Protein with the highest isoelectric point:
>tr|A5PCQ3|A5PCQ3_9SPHN Ribonuclease P protein component OS=Erythrobacter sp. SD-21 OX=161528 GN=rnpA PE=3 SV=1
MM1 pKa = 7.45KK2 pKa = 9.61RR3 pKa = 11.84TFQPSNLVRR12 pKa = 11.84ARR14 pKa = 11.84RR15 pKa = 11.84HH16 pKa = 4.89GFFARR21 pKa = 11.84KK22 pKa = 7.42ATPGGRR28 pKa = 11.84KK29 pKa = 8.0VLRR32 pKa = 11.84ARR34 pKa = 11.84RR35 pKa = 11.84ARR37 pKa = 11.84GRR39 pKa = 11.84KK40 pKa = 8.44NLCAA44 pKa = 4.54
MM1 pKa = 7.45KK2 pKa = 9.61RR3 pKa = 11.84TFQPSNLVRR12 pKa = 11.84ARR14 pKa = 11.84RR15 pKa = 11.84HH16 pKa = 4.89GFFARR21 pKa = 11.84KK22 pKa = 7.42ATPGGRR28 pKa = 11.84KK29 pKa = 8.0VLRR32 pKa = 11.84ARR34 pKa = 11.84RR35 pKa = 11.84ARR37 pKa = 11.84GRR39 pKa = 11.84KK40 pKa = 8.44NLCAA44 pKa = 4.54
Molecular weight: 5.09 kDa
Isoelectric point according different methods:
Peptides (in silico digests for buttom-up proteomics)
Below you can find in silico digests of the whole proteome with Trypsin, Chymotrypsin, Trypsin+LysC, LysN, ArgC proteases suitable for different mass spec machines.| Try ESI |
 |
|---|
| ChTry ESI |
 |
|---|
| ArgC ESI |
 |
|---|
| LysN ESI |
 |
|---|
| TryLysC ESI |
 |
|---|
| Try MALDI |
 |
|---|
| ChTry MALDI |
 |
|---|
| ArgC MALDI |
 |
|---|
| LysN MALDI |
 |
|---|
| TryLysC MALDI |
 |
|---|
| Try LTQ |
 |
|---|
| ChTry LTQ |
 |
|---|
| ArgC LTQ |
 |
|---|
| LysN LTQ |
 |
|---|
| TryLysC LTQ |
 |
|---|
| Try MSlow |
 |
|---|
| ChTry MSlow |
 |
|---|
| ArgC MSlow |
 |
|---|
| LysN MSlow |
 |
|---|
| TryLysC MSlow |
 |
|---|
| Try MShigh |
 |
|---|
| ChTry MShigh |
 |
|---|
| ArgC MShigh |
 |
|---|
| LysN MShigh |
 |
|---|
| TryLysC MShigh |
 |
|---|
General Statistics
Number of major isoforms |
Number of additional isoforms |
Number of all proteins |
Number of amino acids |
Min. Seq. Length |
Max. Seq. Length |
Avg. Seq. Length |
Avg. Mol. Weight |
|---|---|---|---|---|---|---|---|
0 |
896752 |
14 |
2532 |
305.2 |
33.23 |
Amino acid frequency
Ala |
Cys |
Asp |
Glu |
Phe |
Gly |
His |
Ile |
Lys |
Leu |
|---|---|---|---|---|---|---|---|---|---|
12.063 ± 0.056 | 0.816 ± 0.017 |
6.323 ± 0.048 | 6.874 ± 0.052 |
3.673 ± 0.03 | 8.834 ± 0.065 |
1.955 ± 0.024 | 5.011 ± 0.031 |
3.44 ± 0.042 | 9.713 ± 0.048 |
Met |
Asn |
Gln |
Pro |
Arg |
Ser |
Thr |
Val |
Trp |
Tyr |
|---|---|---|---|---|---|---|---|---|---|
2.534 ± 0.022 | 2.666 ± 0.031 |
4.889 ± 0.037 | 3.152 ± 0.026 |
6.896 ± 0.047 | 5.375 ± 0.036 |
5.184 ± 0.032 | 6.937 ± 0.032 |
1.417 ± 0.018 | 2.248 ± 0.026 |
Most of the basic statistics you can see at this page can be downloaded from this CSV file
Proteome-pI is available under Creative Commons Attribution-NoDerivs license, for more details see here
| Reference: Kozlowski LP. Proteome-pI 2.0: Proteome Isoelectric Point Database Update. Nucleic Acids Res. 2021, doi: 10.1093/nar/gkab944 | Contact: Lukasz P. Kozlowski |
