Basidiobolus meristosporus CBS 931.73
Taxonomy: cellular organisms; Eukaryota; Opisthokonta; Fungi; Fungi incertae sedis; Zoopagomycota; Entomophthoromycotina; Basidiobolomycetes; Basidiobolales; Basidiobolaceae; Basidiobolus; Basidiobolus meristosporus
Average proteome isoelectric point is 6.59
Get precalculated fractions of proteins

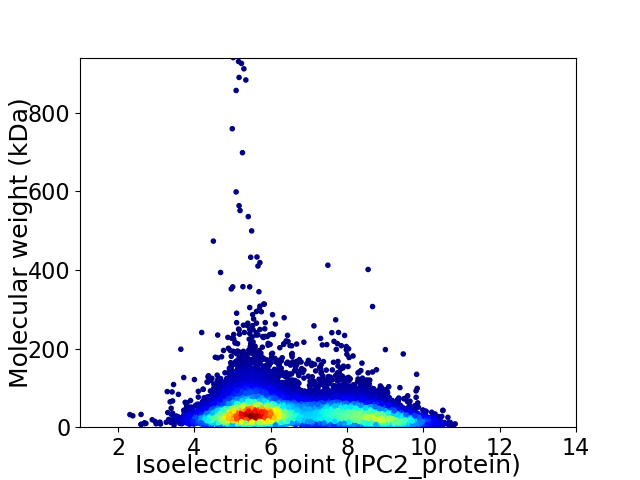
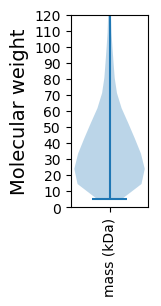
Virtual 2D-PAGE plot for 15513 proteins (isoelectric point calculated using IPC2_protein)
Get csv file with sequences according to given criteria:
* You can choose from 21 different methods for calculating isoelectric point
Summary statistics related to proteome-wise predictions


Protein with the lowest isoelectric point:
>tr|A0A1Y1Y8E7|A0A1Y1Y8E7_9FUNG Alkaline phosphatase OS=Basidiobolus meristosporus CBS 931.73 OX=1314790 GN=K493DRAFT_315600 PE=3 SV=1
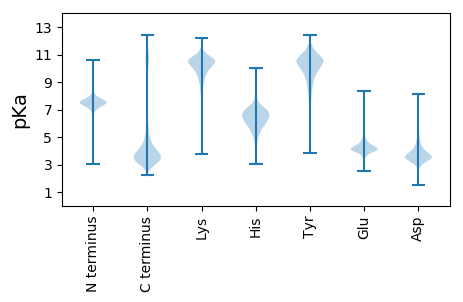
MM1 pKa = 8.09DD2 pKa = 4.51EE3 pKa = 5.25NEE5 pKa = 4.75GEE7 pKa = 4.21DD8 pKa = 3.55EE9 pKa = 5.05GEE11 pKa = 4.94GEE13 pKa = 5.38DD14 pKa = 5.48SMDD17 pKa = 3.85DD18 pKa = 3.22TSTQPEE24 pKa = 4.22SSYY27 pKa = 11.86NMPDD31 pKa = 3.35FNIADD36 pKa = 3.81MQPRR40 pKa = 11.84KK41 pKa = 10.21ALLDD45 pKa = 3.44RR46 pKa = 11.84VNAHH50 pKa = 6.43SSSDD54 pKa = 3.34ADD56 pKa = 3.52ALSNSNQFDD65 pKa = 3.48QAQVIDD71 pKa = 3.63QTLYY75 pKa = 10.62QPKK78 pKa = 9.11QQQPQIIITQPATRR92 pKa = 11.84SYY94 pKa = 11.7GGGQKK99 pKa = 10.04KK100 pKa = 9.31YY101 pKa = 10.77KK102 pKa = 10.06RR103 pKa = 11.84YY104 pKa = 9.73SCSDD108 pKa = 3.37QASDD112 pKa = 5.18CYY114 pKa = 10.77QQVQVQPTVEE124 pKa = 4.2TPNAQVPLLRR134 pKa = 11.84QMFTTVTRR142 pKa = 11.84KK143 pKa = 9.69HH144 pKa = 6.89DD145 pKa = 3.96NLNTANANSDD155 pKa = 3.05KK156 pKa = 11.3SLDD159 pKa = 3.62VQFQAGPSLEE169 pKa = 4.37VEE171 pKa = 4.99GSASASEE178 pKa = 4.07YY179 pKa = 10.89AKK181 pKa = 10.7QKK183 pKa = 10.29GAEE186 pKa = 4.1HH187 pKa = 6.93SDD189 pKa = 3.7DD190 pKa = 3.94GSDD193 pKa = 3.53YY194 pKa = 8.85PTVMVQPAQDD204 pKa = 3.52EE205 pKa = 5.18TYY207 pKa = 8.91STPVVDD213 pKa = 4.05TQCIEE218 pKa = 4.09GCSDD222 pKa = 3.12QDD224 pKa = 3.6TQYY227 pKa = 10.94SEE229 pKa = 4.12PMEE232 pKa = 5.12DD233 pKa = 3.61VQCVDD238 pKa = 3.78DD239 pKa = 5.24CANQDD244 pKa = 3.33SQYY247 pKa = 9.58TEE249 pKa = 4.1PMEE252 pKa = 4.48DD253 pKa = 3.32TQQ255 pKa = 5.09
MM1 pKa = 8.09DD2 pKa = 4.51EE3 pKa = 5.25NEE5 pKa = 4.75GEE7 pKa = 4.21DD8 pKa = 3.55EE9 pKa = 5.05GEE11 pKa = 4.94GEE13 pKa = 5.38DD14 pKa = 5.48SMDD17 pKa = 3.85DD18 pKa = 3.22TSTQPEE24 pKa = 4.22SSYY27 pKa = 11.86NMPDD31 pKa = 3.35FNIADD36 pKa = 3.81MQPRR40 pKa = 11.84KK41 pKa = 10.21ALLDD45 pKa = 3.44RR46 pKa = 11.84VNAHH50 pKa = 6.43SSSDD54 pKa = 3.34ADD56 pKa = 3.52ALSNSNQFDD65 pKa = 3.48QAQVIDD71 pKa = 3.63QTLYY75 pKa = 10.62QPKK78 pKa = 9.11QQQPQIIITQPATRR92 pKa = 11.84SYY94 pKa = 11.7GGGQKK99 pKa = 10.04KK100 pKa = 9.31YY101 pKa = 10.77KK102 pKa = 10.06RR103 pKa = 11.84YY104 pKa = 9.73SCSDD108 pKa = 3.37QASDD112 pKa = 5.18CYY114 pKa = 10.77QQVQVQPTVEE124 pKa = 4.2TPNAQVPLLRR134 pKa = 11.84QMFTTVTRR142 pKa = 11.84KK143 pKa = 9.69HH144 pKa = 6.89DD145 pKa = 3.96NLNTANANSDD155 pKa = 3.05KK156 pKa = 11.3SLDD159 pKa = 3.62VQFQAGPSLEE169 pKa = 4.37VEE171 pKa = 4.99GSASASEE178 pKa = 4.07YY179 pKa = 10.89AKK181 pKa = 10.7QKK183 pKa = 10.29GAEE186 pKa = 4.1HH187 pKa = 6.93SDD189 pKa = 3.7DD190 pKa = 3.94GSDD193 pKa = 3.53YY194 pKa = 8.85PTVMVQPAQDD204 pKa = 3.52EE205 pKa = 5.18TYY207 pKa = 8.91STPVVDD213 pKa = 4.05TQCIEE218 pKa = 4.09GCSDD222 pKa = 3.12QDD224 pKa = 3.6TQYY227 pKa = 10.94SEE229 pKa = 4.12PMEE232 pKa = 5.12DD233 pKa = 3.61VQCVDD238 pKa = 3.78DD239 pKa = 5.24CANQDD244 pKa = 3.33SQYY247 pKa = 9.58TEE249 pKa = 4.1PMEE252 pKa = 4.48DD253 pKa = 3.32TQQ255 pKa = 5.09
Molecular weight: 28.25 kDa
Isoelectric point according different methods:
Protein with the highest isoelectric point:
>tr|A0A1Y1Y430|A0A1Y1Y430_9FUNG Uncharacterized protein OS=Basidiobolus meristosporus CBS 931.73 OX=1314790 GN=K493DRAFT_354074 PE=4 SV=1
KKK2 pKa = 10.14HHH4 pKa = 4.91CTLCSRR10 pKa = 11.84SFQRR14 pKa = 11.84PSALRR19 pKa = 11.84IHHH22 pKa = 6.88YYY24 pKa = 10.13HHH26 pKa = 6.73GEEE29 pKa = 4.38KK30 pKa = 10.26FEEE33 pKa = 4.05SYYY36 pKa = 10.78GCQKKK41 pKa = 10.49FNVEEE46 pKa = 3.81NLRR49 pKa = 11.84RR50 pKa = 11.84HHH52 pKa = 6.07RR53 pKa = 11.84TH
KKK2 pKa = 10.14HHH4 pKa = 4.91CTLCSRR10 pKa = 11.84SFQRR14 pKa = 11.84PSALRR19 pKa = 11.84IHHH22 pKa = 6.88YYY24 pKa = 10.13HHH26 pKa = 6.73GEEE29 pKa = 4.38KK30 pKa = 10.26FEEE33 pKa = 4.05SYYY36 pKa = 10.78GCQKKK41 pKa = 10.49FNVEEE46 pKa = 3.81NLRR49 pKa = 11.84RR50 pKa = 11.84HHH52 pKa = 6.07RR53 pKa = 11.84TH
Molecular weight: 6.68 kDa
Isoelectric point according different methods:
Peptides (in silico digests for buttom-up proteomics)
Below you can find in silico digests of the whole proteome with Trypsin, Chymotrypsin, Trypsin+LysC, LysN, ArgC proteases suitable for different mass spec machines.| Try ESI |
 |
|---|
| ChTry ESI |
 |
|---|
| ArgC ESI |
 |
|---|
| LysN ESI |
 |
|---|
| TryLysC ESI |
 |
|---|
| Try MALDI |
 |
|---|
| ChTry MALDI |
 |
|---|
| ArgC MALDI |
 |
|---|
| LysN MALDI |
 |
|---|
| TryLysC MALDI |
 |
|---|
| Try LTQ |
 |
|---|
| ChTry LTQ |
 |
|---|
| ArgC LTQ |
 |
|---|
| LysN LTQ |
 |
|---|
| TryLysC LTQ |
 |
|---|
| Try MSlow |
 |
|---|
| ChTry MSlow |
 |
|---|
| ArgC MSlow |
 |
|---|
| LysN MSlow |
 |
|---|
| TryLysC MSlow |
 |
|---|
| Try MShigh |
 |
|---|
| ChTry MShigh |
 |
|---|
| ArgC MShigh |
 |
|---|
| LysN MShigh |
 |
|---|
| TryLysC MShigh |
 |
|---|
General Statistics
Number of major isoforms |
Number of additional isoforms |
Number of all proteins |
Number of amino acids |
Min. Seq. Length |
Max. Seq. Length |
Avg. Seq. Length |
Avg. Mol. Weight |
|---|---|---|---|---|---|---|---|
0 |
5895669 |
49 |
8462 |
380.0 |
42.56 |
Amino acid frequency
Ala |
Cys |
Asp |
Glu |
Phe |
Gly |
His |
Ile |
Lys |
Leu |
|---|---|---|---|---|---|---|---|---|---|
6.859 ± 0.017 | 1.506 ± 0.008 |
5.257 ± 0.016 | 6.487 ± 0.021 |
4.204 ± 0.015 | 6.202 ± 0.032 |
2.403 ± 0.009 | 5.886 ± 0.016 |
5.858 ± 0.021 | 9.409 ± 0.023 |
Met |
Asn |
Gln |
Pro |
Arg |
Ser |
Thr |
Val |
Trp |
Tyr |
|---|---|---|---|---|---|---|---|---|---|
2.22 ± 0.009 | 4.558 ± 0.013 |
5.075 ± 0.019 | 4.013 ± 0.015 |
5.07 ± 0.015 | 8.181 ± 0.024 |
5.824 ± 0.017 | 6.378 ± 0.013 |
1.201 ± 0.007 | 3.407 ± 0.013 |
Most of the basic statistics you can see at this page can be downloaded from this CSV file
Proteome-pI is available under Creative Commons Attribution-NoDerivs license, for more details see here
| Reference: Kozlowski LP. Proteome-pI 2.0: Proteome Isoelectric Point Database Update. Nucleic Acids Res. 2021, doi: 10.1093/nar/gkab944 | Contact: Lukasz P. Kozlowski |
