Aidingimonas halophila
Taxonomy: cellular organisms; Bacteria; Proteobacteria; Gammaproteobacteria; Oceanospirillales; Halomonadaceae; Aidingimonas
Average proteome isoelectric point is 5.94
Get precalculated fractions of proteins

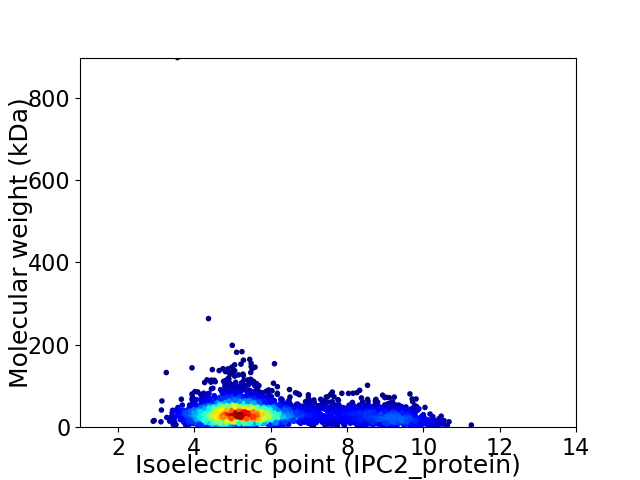
Virtual 2D-PAGE plot for 3626 proteins (isoelectric point calculated using IPC2_protein)
Get csv file with sequences according to given criteria:
* You can choose from 21 different methods for calculating isoelectric point
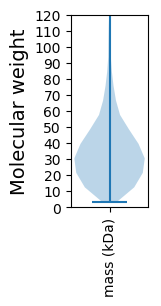
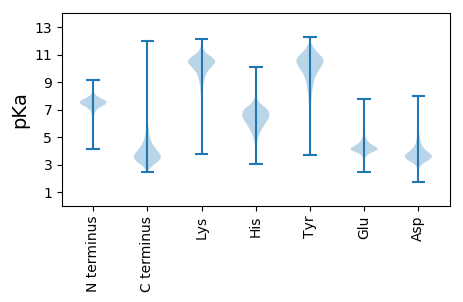
Summary statistics related to proteome-wise predictions


Protein with the lowest isoelectric point:
>tr|A0A1H3AYB2|A0A1H3AYB2_9GAMM UPF0250 protein SAMN05443545_10568 OS=Aidingimonas halophila OX=574349 GN=SAMN05443545_10568 PE=3 SV=1
MM1 pKa = 7.22IANVAIYY8 pKa = 8.94KK9 pKa = 9.03WCLITFSILWLAGCSDD25 pKa = 3.76QSWRR29 pKa = 11.84TTSISDD35 pKa = 3.76IMPDD39 pKa = 3.52LDD41 pKa = 4.71FEE43 pKa = 4.94LVDD46 pKa = 3.96EE47 pKa = 4.77NGEE50 pKa = 4.04AVTDD54 pKa = 4.29DD55 pKa = 4.53EE56 pKa = 4.9YY57 pKa = 11.63LGNPTLLYY65 pKa = 10.68FGFTYY70 pKa = 10.76CPDD73 pKa = 3.26VCPNTLSRR81 pKa = 11.84LATAIGQLDD90 pKa = 3.77AEE92 pKa = 4.5VRR94 pKa = 11.84DD95 pKa = 4.63DD96 pKa = 3.47IRR98 pKa = 11.84VLFVSVDD105 pKa = 3.54PGRR108 pKa = 11.84DD109 pKa = 3.36TPEE112 pKa = 3.62VLSRR116 pKa = 11.84YY117 pKa = 7.68TDD119 pKa = 2.92AFGPQFIGLSGDD131 pKa = 3.31NSALDD136 pKa = 3.8AVTKK140 pKa = 10.1RR141 pKa = 11.84YY142 pKa = 9.64RR143 pKa = 11.84VTYY146 pKa = 10.14SYY148 pKa = 11.67GEE150 pKa = 4.0EE151 pKa = 4.38DD152 pKa = 3.07SDD154 pKa = 3.9GNYY157 pKa = 10.92DD158 pKa = 3.65VTHH161 pKa = 6.69SSAVFAFDD169 pKa = 4.26QNGEE173 pKa = 4.07AQFMIRR179 pKa = 11.84DD180 pKa = 3.94TDD182 pKa = 3.75SMQDD186 pKa = 2.97IVSDD190 pKa = 4.29LDD192 pKa = 3.33QLVAEE197 pKa = 4.72EE198 pKa = 4.2
MM1 pKa = 7.22IANVAIYY8 pKa = 8.94KK9 pKa = 9.03WCLITFSILWLAGCSDD25 pKa = 3.76QSWRR29 pKa = 11.84TTSISDD35 pKa = 3.76IMPDD39 pKa = 3.52LDD41 pKa = 4.71FEE43 pKa = 4.94LVDD46 pKa = 3.96EE47 pKa = 4.77NGEE50 pKa = 4.04AVTDD54 pKa = 4.29DD55 pKa = 4.53EE56 pKa = 4.9YY57 pKa = 11.63LGNPTLLYY65 pKa = 10.68FGFTYY70 pKa = 10.76CPDD73 pKa = 3.26VCPNTLSRR81 pKa = 11.84LATAIGQLDD90 pKa = 3.77AEE92 pKa = 4.5VRR94 pKa = 11.84DD95 pKa = 4.63DD96 pKa = 3.47IRR98 pKa = 11.84VLFVSVDD105 pKa = 3.54PGRR108 pKa = 11.84DD109 pKa = 3.36TPEE112 pKa = 3.62VLSRR116 pKa = 11.84YY117 pKa = 7.68TDD119 pKa = 2.92AFGPQFIGLSGDD131 pKa = 3.31NSALDD136 pKa = 3.8AVTKK140 pKa = 10.1RR141 pKa = 11.84YY142 pKa = 9.64RR143 pKa = 11.84VTYY146 pKa = 10.14SYY148 pKa = 11.67GEE150 pKa = 4.0EE151 pKa = 4.38DD152 pKa = 3.07SDD154 pKa = 3.9GNYY157 pKa = 10.92DD158 pKa = 3.65VTHH161 pKa = 6.69SSAVFAFDD169 pKa = 4.26QNGEE173 pKa = 4.07AQFMIRR179 pKa = 11.84DD180 pKa = 3.94TDD182 pKa = 3.75SMQDD186 pKa = 2.97IVSDD190 pKa = 4.29LDD192 pKa = 3.33QLVAEE197 pKa = 4.72EE198 pKa = 4.2
Molecular weight: 22.07 kDa
Isoelectric point according different methods:
Protein with the highest isoelectric point:
>tr|A0A1H2XSR1|A0A1H2XSR1_9GAMM L-threonine dehydratase OS=Aidingimonas halophila OX=574349 GN=ilvA PE=3 SV=1
MM1 pKa = 7.45KK2 pKa = 9.51RR3 pKa = 11.84TFQPSVIKK11 pKa = 10.2RR12 pKa = 11.84KK13 pKa = 9.69RR14 pKa = 11.84MHH16 pKa = 6.75GFRR19 pKa = 11.84ARR21 pKa = 11.84MATKK25 pKa = 10.3NGRR28 pKa = 11.84AVLARR33 pKa = 11.84RR34 pKa = 11.84RR35 pKa = 11.84AKK37 pKa = 9.93GRR39 pKa = 11.84KK40 pKa = 8.85RR41 pKa = 11.84LSAA44 pKa = 3.96
MM1 pKa = 7.45KK2 pKa = 9.51RR3 pKa = 11.84TFQPSVIKK11 pKa = 10.2RR12 pKa = 11.84KK13 pKa = 9.69RR14 pKa = 11.84MHH16 pKa = 6.75GFRR19 pKa = 11.84ARR21 pKa = 11.84MATKK25 pKa = 10.3NGRR28 pKa = 11.84AVLARR33 pKa = 11.84RR34 pKa = 11.84RR35 pKa = 11.84AKK37 pKa = 9.93GRR39 pKa = 11.84KK40 pKa = 8.85RR41 pKa = 11.84LSAA44 pKa = 3.96
Molecular weight: 5.18 kDa
Isoelectric point according different methods:
Peptides (in silico digests for buttom-up proteomics)
Below you can find in silico digests of the whole proteome with Trypsin, Chymotrypsin, Trypsin+LysC, LysN, ArgC proteases suitable for different mass spec machines.| Try ESI |
 |
|---|
| ChTry ESI |
 |
|---|
| ArgC ESI |
 |
|---|
| LysN ESI |
 |
|---|
| TryLysC ESI |
 |
|---|
| Try MALDI |
 |
|---|
| ChTry MALDI |
 |
|---|
| ArgC MALDI |
 |
|---|
| LysN MALDI |
 |
|---|
| TryLysC MALDI |
 |
|---|
| Try LTQ |
 |
|---|
| ChTry LTQ |
 |
|---|
| ArgC LTQ |
 |
|---|
| LysN LTQ |
 |
|---|
| TryLysC LTQ |
 |
|---|
| Try MSlow |
 |
|---|
| ChTry MSlow |
 |
|---|
| ArgC MSlow |
 |
|---|
| LysN MSlow |
 |
|---|
| TryLysC MSlow |
 |
|---|
| Try MShigh |
 |
|---|
| ChTry MShigh |
 |
|---|
| ArgC MShigh |
 |
|---|
| LysN MShigh |
 |
|---|
| TryLysC MShigh |
 |
|---|
General Statistics
Number of major isoforms |
Number of additional isoforms |
Number of all proteins |
Number of amino acids |
Min. Seq. Length |
Max. Seq. Length |
Avg. Seq. Length |
Avg. Mol. Weight |
|---|---|---|---|---|---|---|---|
0 |
1177209 |
29 |
8694 |
324.7 |
35.76 |
Amino acid frequency
Ala |
Cys |
Asp |
Glu |
Phe |
Gly |
His |
Ile |
Lys |
Leu |
|---|---|---|---|---|---|---|---|---|---|
10.289 ± 0.042 | 0.983 ± 0.016 |
6.389 ± 0.055 | 6.48 ± 0.044 |
3.447 ± 0.029 | 8.04 ± 0.055 |
2.592 ± 0.03 | 5.082 ± 0.033 |
2.545 ± 0.035 | 11.102 ± 0.053 |
Met |
Asn |
Gln |
Pro |
Arg |
Ser |
Thr |
Val |
Trp |
Tyr |
|---|---|---|---|---|---|---|---|---|---|
2.641 ± 0.02 | 2.676 ± 0.021 |
4.788 ± 0.034 | 3.819 ± 0.027 |
7.074 ± 0.046 | 5.804 ± 0.036 |
5.185 ± 0.029 | 7.096 ± 0.038 |
1.485 ± 0.021 | 2.482 ± 0.021 |
Most of the basic statistics you can see at this page can be downloaded from this CSV file
Proteome-pI is available under Creative Commons Attribution-NoDerivs license, for more details see here
| Reference: Kozlowski LP. Proteome-pI 2.0: Proteome Isoelectric Point Database Update. Nucleic Acids Res. 2021, doi: 10.1093/nar/gkab944 | Contact: Lukasz P. Kozlowski |
