Nitrosomonas sp. (strain Is79A3)
Taxonomy: cellular organisms; Bacteria; Proteobacteria; Betaproteobacteria; Nitrosomonadales; Nitrosomonadaceae; Nitrosomonas; unclassified Nitrosomonas
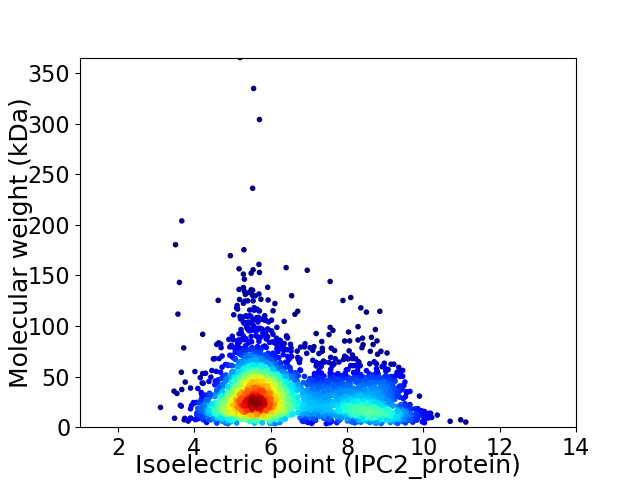
Average proteome isoelectric point is 6.49
Get precalculated fractions of proteins

Virtual 2D-PAGE plot for 3273 proteins (isoelectric point calculated using IPC2_protein)
Get csv file with sequences according to given criteria:
* You can choose from 21 different methods for calculating isoelectric point
Summary statistics related to proteome-wise predictions


Protein with the lowest isoelectric point:
>tr|F8GLX1|F8GLX1_NITSI Uncharacterized protein OS=Nitrosomonas sp. (strain Is79A3) OX=261292 GN=Nit79A3_3319 PE=4 SV=1
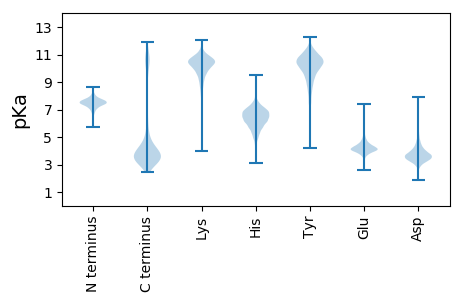
MM1 pKa = 7.13TFHH4 pKa = 6.71VFHH7 pKa = 7.66INEE10 pKa = 4.28VYY12 pKa = 10.95SNANGTVQFIEE23 pKa = 4.53FSGDD27 pKa = 3.81ANDD30 pKa = 3.44QDD32 pKa = 3.74EE33 pKa = 4.75WAGHH37 pKa = 6.59TITSTNGVTTNTYY50 pKa = 8.46TIPTNLPSEE59 pKa = 4.18ATLNKK64 pKa = 8.68TVLVATQGFADD75 pKa = 4.68LGIVTPDD82 pKa = 3.34YY83 pKa = 10.68IIPNGFLFTTSGIVNFPGMVGGKK106 pKa = 7.64ITYY109 pKa = 7.58ATLPVDD115 pKa = 5.1GIKK118 pKa = 10.52SLNPDD123 pKa = 3.06SSSGINSPQNFAGDD137 pKa = 3.72TGTVPSNVFSGTDD150 pKa = 3.47GPDD153 pKa = 3.28NLVGTSGDD161 pKa = 3.96DD162 pKa = 4.07FILGADD168 pKa = 4.08GQDD171 pKa = 3.42TLNGTGGNDD180 pKa = 3.48TLSGGLGVDD189 pKa = 3.26TAIYY193 pKa = 10.24NSNRR197 pKa = 11.84ANYY200 pKa = 9.67SILGTSTGLSISGPDD215 pKa = 3.63GNDD218 pKa = 2.85TVSGIEE224 pKa = 3.89RR225 pKa = 11.84FQFTDD230 pKa = 2.98KK231 pKa = 11.25NIAVDD236 pKa = 4.45LNAGQAASNTVRR248 pKa = 11.84IIGAAFDD255 pKa = 3.91APTIDD260 pKa = 3.45EE261 pKa = 4.6HH262 pKa = 6.88PDD264 pKa = 3.29YY265 pKa = 11.53VGIGLNLFDD274 pKa = 4.77SGQSILEE281 pKa = 4.12VAQLVIGVLGNPSNGAFVDD300 pKa = 3.96KK301 pKa = 10.98VFQNVVGAAPSAADD315 pKa = 3.07HH316 pKa = 6.77DD317 pKa = 5.04FYY319 pKa = 11.88VGLLQGSGGSYY330 pKa = 8.66TQAEE334 pKa = 4.78LLVLAANSDD343 pKa = 3.99VNATNIDD350 pKa = 4.01LVGLQQSGVVFAA362 pKa = 5.6
MM1 pKa = 7.13TFHH4 pKa = 6.71VFHH7 pKa = 7.66INEE10 pKa = 4.28VYY12 pKa = 10.95SNANGTVQFIEE23 pKa = 4.53FSGDD27 pKa = 3.81ANDD30 pKa = 3.44QDD32 pKa = 3.74EE33 pKa = 4.75WAGHH37 pKa = 6.59TITSTNGVTTNTYY50 pKa = 8.46TIPTNLPSEE59 pKa = 4.18ATLNKK64 pKa = 8.68TVLVATQGFADD75 pKa = 4.68LGIVTPDD82 pKa = 3.34YY83 pKa = 10.68IIPNGFLFTTSGIVNFPGMVGGKK106 pKa = 7.64ITYY109 pKa = 7.58ATLPVDD115 pKa = 5.1GIKK118 pKa = 10.52SLNPDD123 pKa = 3.06SSSGINSPQNFAGDD137 pKa = 3.72TGTVPSNVFSGTDD150 pKa = 3.47GPDD153 pKa = 3.28NLVGTSGDD161 pKa = 3.96DD162 pKa = 4.07FILGADD168 pKa = 4.08GQDD171 pKa = 3.42TLNGTGGNDD180 pKa = 3.48TLSGGLGVDD189 pKa = 3.26TAIYY193 pKa = 10.24NSNRR197 pKa = 11.84ANYY200 pKa = 9.67SILGTSTGLSISGPDD215 pKa = 3.63GNDD218 pKa = 2.85TVSGIEE224 pKa = 3.89RR225 pKa = 11.84FQFTDD230 pKa = 2.98KK231 pKa = 11.25NIAVDD236 pKa = 4.45LNAGQAASNTVRR248 pKa = 11.84IIGAAFDD255 pKa = 3.91APTIDD260 pKa = 3.45EE261 pKa = 4.6HH262 pKa = 6.88PDD264 pKa = 3.29YY265 pKa = 11.53VGIGLNLFDD274 pKa = 4.77SGQSILEE281 pKa = 4.12VAQLVIGVLGNPSNGAFVDD300 pKa = 3.96KK301 pKa = 10.98VFQNVVGAAPSAADD315 pKa = 3.07HH316 pKa = 6.77DD317 pKa = 5.04FYY319 pKa = 11.88VGLLQGSGGSYY330 pKa = 8.66TQAEE334 pKa = 4.78LLVLAANSDD343 pKa = 3.99VNATNIDD350 pKa = 4.01LVGLQQSGVVFAA362 pKa = 5.6
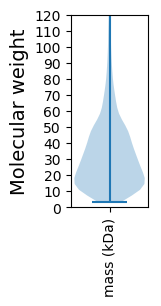
Molecular weight: 37.23 kDa
Isoelectric point according different methods:
Protein with the highest isoelectric point:
>tr|F8GHV1|F8GHV1_NITSI Transport permease protein OS=Nitrosomonas sp. (strain Is79A3) OX=261292 GN=Nit79A3_0435 PE=3 SV=1
MM1 pKa = 7.35KK2 pKa = 9.36RR3 pKa = 11.84TYY5 pKa = 10.06QPSVTRR11 pKa = 11.84RR12 pKa = 11.84KK13 pKa = 8.43RR14 pKa = 11.84THH16 pKa = 5.88GFLVRR21 pKa = 11.84MKK23 pKa = 9.13TRR25 pKa = 11.84AGAAVIRR32 pKa = 11.84ARR34 pKa = 11.84RR35 pKa = 11.84AKK37 pKa = 9.96GRR39 pKa = 11.84ARR41 pKa = 11.84LSVV44 pKa = 3.12
MM1 pKa = 7.35KK2 pKa = 9.36RR3 pKa = 11.84TYY5 pKa = 10.06QPSVTRR11 pKa = 11.84RR12 pKa = 11.84KK13 pKa = 8.43RR14 pKa = 11.84THH16 pKa = 5.88GFLVRR21 pKa = 11.84MKK23 pKa = 9.13TRR25 pKa = 11.84AGAAVIRR32 pKa = 11.84ARR34 pKa = 11.84RR35 pKa = 11.84AKK37 pKa = 9.96GRR39 pKa = 11.84ARR41 pKa = 11.84LSVV44 pKa = 3.12
Molecular weight: 5.1 kDa
Isoelectric point according different methods:
Peptides (in silico digests for buttom-up proteomics)
Below you can find in silico digests of the whole proteome with Trypsin, Chymotrypsin, Trypsin+LysC, LysN, ArgC proteases suitable for different mass spec machines.| Try ESI |
 |
|---|
| ChTry ESI |
 |
|---|
| ArgC ESI |
 |
|---|
| LysN ESI |
 |
|---|
| TryLysC ESI |
 |
|---|
| Try MALDI |
 |
|---|
| ChTry MALDI |
 |
|---|
| ArgC MALDI |
 |
|---|
| LysN MALDI |
 |
|---|
| TryLysC MALDI |
 |
|---|
| Try LTQ |
 |
|---|
| ChTry LTQ |
 |
|---|
| ArgC LTQ |
 |
|---|
| LysN LTQ |
 |
|---|
| TryLysC LTQ |
 |
|---|
| Try MSlow |
 |
|---|
| ChTry MSlow |
 |
|---|
| ArgC MSlow |
 |
|---|
| LysN MSlow |
 |
|---|
| TryLysC MSlow |
 |
|---|
| Try MShigh |
 |
|---|
| ChTry MShigh |
 |
|---|
| ArgC MShigh |
 |
|---|
| LysN MShigh |
 |
|---|
| TryLysC MShigh |
 |
|---|
General Statistics
Number of major isoforms |
Number of additional isoforms |
Number of all proteins |
Number of amino acids |
Min. Seq. Length |
Max. Seq. Length |
Avg. Seq. Length |
Avg. Mol. Weight |
|---|---|---|---|---|---|---|---|
0 |
1023771 |
31 |
3212 |
312.8 |
34.8 |
Amino acid frequency
Ala |
Cys |
Asp |
Glu |
Phe |
Gly |
His |
Ile |
Lys |
Leu |
|---|---|---|---|---|---|---|---|---|---|
8.97 ± 0.047 | 1.013 ± 0.014 |
5.315 ± 0.032 | 6.019 ± 0.042 |
4.036 ± 0.028 | 6.836 ± 0.037 |
2.415 ± 0.021 | 7.001 ± 0.036 |
5.136 ± 0.049 | 10.466 ± 0.053 |
Met |
Asn |
Gln |
Pro |
Arg |
Ser |
Thr |
Val |
Trp |
Tyr |
|---|---|---|---|---|---|---|---|---|---|
2.415 ± 0.02 | 4.279 ± 0.034 |
4.276 ± 0.028 | 4.35 ± 0.031 |
5.315 ± 0.044 | 6.22 ± 0.031 |
5.437 ± 0.041 | 6.324 ± 0.033 |
1.301 ± 0.017 | 2.875 ± 0.024 |
Most of the basic statistics you can see at this page can be downloaded from this CSV file
Proteome-pI is available under Creative Commons Attribution-NoDerivs license, for more details see here
| Reference: Kozlowski LP. Proteome-pI 2.0: Proteome Isoelectric Point Database Update. Nucleic Acids Res. 2021, doi: 10.1093/nar/gkab944 | Contact: Lukasz P. Kozlowski |
