Dufourea novaeangliae (Sweat bee)
Taxonomy: cellular organisms; Eukaryota; Opisthokonta; Metazoa; Eumetazoa; Bilateria; Protostomia; Ecdysozoa; Panarthropoda; Arthropoda; Mandibulata; Pancrustacea; Hexapoda; Insecta; Dicondylia; Pterygota; Neoptera; Endopterygota; Hymenoptera; Apocrita; Aculeata; Apoidea; Halictidae;
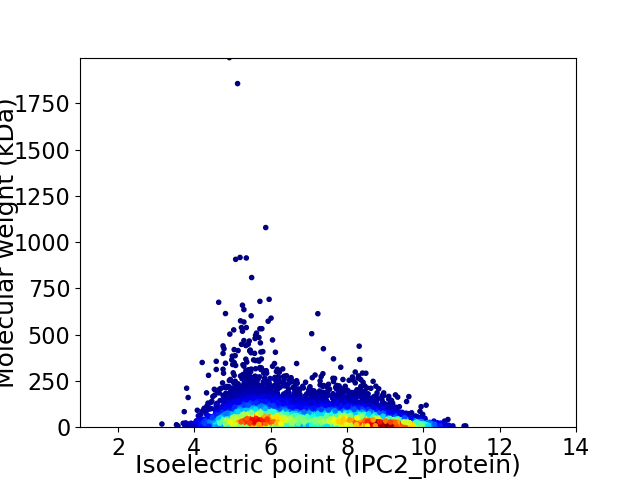
Average proteome isoelectric point is 7.0
Get precalculated fractions of proteins

Virtual 2D-PAGE plot for 11355 proteins (isoelectric point calculated using IPC2_protein)
Get csv file with sequences according to given criteria:
* You can choose from 21 different methods for calculating isoelectric point
Summary statistics related to proteome-wise predictions


Protein with the lowest isoelectric point:
>tr|A0A154PN07|A0A154PN07_DUFNO DUF4758 domain-containing protein OS=Dufourea novaeangliae OX=178035 GN=WN55_05931 PE=4 SV=1
MM1 pKa = 7.32MNFEE5 pKa = 4.67GEE7 pKa = 4.24QGSMRR12 pKa = 11.84SSSSRR17 pKa = 11.84NIICCLATARR27 pKa = 11.84YY28 pKa = 9.73NNISQAIQFWVYY40 pKa = 10.89SQLKK44 pKa = 8.94KK45 pKa = 10.6ARR47 pKa = 11.84NMDD50 pKa = 4.07DD51 pKa = 4.79LQDD54 pKa = 3.74QSDD57 pKa = 3.81HH58 pKa = 6.38GLIYY62 pKa = 10.47CRR64 pKa = 11.84YY65 pKa = 10.46DD66 pKa = 2.92NSTNNNTLMEE76 pKa = 4.19YY77 pKa = 10.94LEE79 pKa = 4.66LDD81 pKa = 3.5NRR83 pKa = 11.84TSDD86 pKa = 3.71PLNEE90 pKa = 4.66PEE92 pKa = 3.9VTMNLNEE99 pKa = 4.45GSVQLLLYY107 pKa = 9.62PLEE110 pKa = 4.22EE111 pKa = 4.88LEE113 pKa = 5.07EE114 pKa = 4.64DD115 pKa = 3.39MFDD118 pKa = 4.1YY119 pKa = 9.34EE120 pKa = 4.99TDD122 pKa = 3.23TSSQDD127 pKa = 3.33GNIEE131 pKa = 3.95SQEE134 pKa = 3.88QVVPSSQLSNNHH146 pKa = 6.75KK147 pKa = 10.57YY148 pKa = 10.34PEE150 pKa = 4.34EE151 pKa = 3.83LTISDD156 pKa = 5.38DD157 pKa = 4.35EE158 pKa = 5.58IDD160 pKa = 4.59DD161 pKa = 4.28GGTFEE166 pKa = 6.06DD167 pKa = 4.54EE168 pKa = 4.29PVSNLLLNDD177 pKa = 3.62NDD179 pKa = 4.58TDD181 pKa = 4.53DD182 pKa = 4.13SQPPP186 pKa = 3.32
MM1 pKa = 7.32MNFEE5 pKa = 4.67GEE7 pKa = 4.24QGSMRR12 pKa = 11.84SSSSRR17 pKa = 11.84NIICCLATARR27 pKa = 11.84YY28 pKa = 9.73NNISQAIQFWVYY40 pKa = 10.89SQLKK44 pKa = 8.94KK45 pKa = 10.6ARR47 pKa = 11.84NMDD50 pKa = 4.07DD51 pKa = 4.79LQDD54 pKa = 3.74QSDD57 pKa = 3.81HH58 pKa = 6.38GLIYY62 pKa = 10.47CRR64 pKa = 11.84YY65 pKa = 10.46DD66 pKa = 2.92NSTNNNTLMEE76 pKa = 4.19YY77 pKa = 10.94LEE79 pKa = 4.66LDD81 pKa = 3.5NRR83 pKa = 11.84TSDD86 pKa = 3.71PLNEE90 pKa = 4.66PEE92 pKa = 3.9VTMNLNEE99 pKa = 4.45GSVQLLLYY107 pKa = 9.62PLEE110 pKa = 4.22EE111 pKa = 4.88LEE113 pKa = 5.07EE114 pKa = 4.64DD115 pKa = 3.39MFDD118 pKa = 4.1YY119 pKa = 9.34EE120 pKa = 4.99TDD122 pKa = 3.23TSSQDD127 pKa = 3.33GNIEE131 pKa = 3.95SQEE134 pKa = 3.88QVVPSSQLSNNHH146 pKa = 6.75KK147 pKa = 10.57YY148 pKa = 10.34PEE150 pKa = 4.34EE151 pKa = 3.83LTISDD156 pKa = 5.38DD157 pKa = 4.35EE158 pKa = 5.58IDD160 pKa = 4.59DD161 pKa = 4.28GGTFEE166 pKa = 6.06DD167 pKa = 4.54EE168 pKa = 4.29PVSNLLLNDD177 pKa = 3.62NDD179 pKa = 4.58TDD181 pKa = 4.53DD182 pKa = 4.13SQPPP186 pKa = 3.32
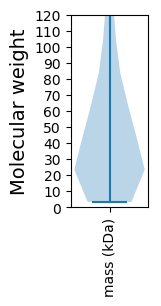
Molecular weight: 21.25 kDa
Isoelectric point according different methods:
Protein with the highest isoelectric point:
>tr|A0A154PQN9|A0A154PQN9_DUFNO 5-hydroxytryptamine receptor 2B OS=Dufourea novaeangliae OX=178035 GN=WN55_05217 PE=3 SV=1
MM1 pKa = 7.03HH2 pKa = 7.52RR3 pKa = 11.84RR4 pKa = 11.84RR5 pKa = 11.84VRR7 pKa = 11.84RR8 pKa = 11.84IPTARR13 pKa = 11.84AAAFSRR19 pKa = 11.84QKK21 pKa = 10.65RR22 pKa = 11.84GGPSRR27 pKa = 11.84WWWKK31 pKa = 8.96YY32 pKa = 8.08KK33 pKa = 10.2ARR35 pKa = 11.84GVAGHH40 pKa = 5.72SQSVSGTPTPSRR52 pKa = 11.84SASLKK57 pKa = 6.97PTPII61 pKa = 4.53
MM1 pKa = 7.03HH2 pKa = 7.52RR3 pKa = 11.84RR4 pKa = 11.84RR5 pKa = 11.84VRR7 pKa = 11.84RR8 pKa = 11.84IPTARR13 pKa = 11.84AAAFSRR19 pKa = 11.84QKK21 pKa = 10.65RR22 pKa = 11.84GGPSRR27 pKa = 11.84WWWKK31 pKa = 8.96YY32 pKa = 8.08KK33 pKa = 10.2ARR35 pKa = 11.84GVAGHH40 pKa = 5.72SQSVSGTPTPSRR52 pKa = 11.84SASLKK57 pKa = 6.97PTPII61 pKa = 4.53
Molecular weight: 6.88 kDa
Isoelectric point according different methods:
Peptides (in silico digests for buttom-up proteomics)
Below you can find in silico digests of the whole proteome with Trypsin, Chymotrypsin, Trypsin+LysC, LysN, ArgC proteases suitable for different mass spec machines.| Try ESI |
 |
|---|
| ChTry ESI |
 |
|---|
| ArgC ESI |
 |
|---|
| LysN ESI |
 |
|---|
| TryLysC ESI |
 |
|---|
| Try MALDI |
 |
|---|
| ChTry MALDI |
 |
|---|
| ArgC MALDI |
 |
|---|
| LysN MALDI |
 |
|---|
| TryLysC MALDI |
 |
|---|
| Try LTQ |
 |
|---|
| ChTry LTQ |
 |
|---|
| ArgC LTQ |
 |
|---|
| LysN LTQ |
 |
|---|
| TryLysC LTQ |
 |
|---|
| Try MSlow |
 |
|---|
| ChTry MSlow |
 |
|---|
| ArgC MSlow |
 |
|---|
| LysN MSlow |
 |
|---|
| TryLysC MSlow |
 |
|---|
| Try MShigh |
 |
|---|
| ChTry MShigh |
 |
|---|
| ArgC MShigh |
 |
|---|
| LysN MShigh |
 |
|---|
| TryLysC MShigh |
 |
|---|
General Statistics
Number of major isoforms |
Number of additional isoforms |
Number of all proteins |
Number of amino acids |
Min. Seq. Length |
Max. Seq. Length |
Avg. Seq. Length |
Avg. Mol. Weight |
|---|---|---|---|---|---|---|---|
0 |
5528599 |
29 |
18781 |
486.9 |
54.8 |
Amino acid frequency
Ala |
Cys |
Asp |
Glu |
Phe |
Gly |
His |
Ile |
Lys |
Leu |
|---|---|---|---|---|---|---|---|---|---|
6.063 ± 0.024 | 2.007 ± 0.046 |
5.426 ± 0.019 | 6.879 ± 0.044 |
3.479 ± 0.017 | 5.676 ± 0.031 |
2.498 ± 0.015 | 5.544 ± 0.024 |
6.358 ± 0.038 | 8.924 ± 0.037 |
Met |
Asn |
Gln |
Pro |
Arg |
Ser |
Thr |
Val |
Trp |
Tyr |
|---|---|---|---|---|---|---|---|---|---|
2.241 ± 0.011 | 4.98 ± 0.025 |
5.188 ± 0.033 | 4.248 ± 0.025 |
5.789 ± 0.025 | 8.082 ± 0.031 |
6.142 ± 0.028 | 6.281 ± 0.022 |
1.097 ± 0.009 | 3.087 ± 0.015 |
Most of the basic statistics you can see at this page can be downloaded from this CSV file
Proteome-pI is available under Creative Commons Attribution-NoDerivs license, for more details see here
| Reference: Kozlowski LP. Proteome-pI 2.0: Proteome Isoelectric Point Database Update. Nucleic Acids Res. 2021, doi: 10.1093/nar/gkab944 | Contact: Lukasz P. Kozlowski |
