Sphingomonas carotinifaciens
Taxonomy: cellular organisms; Bacteria; Proteobacteria; Alphaproteobacter
Average proteome isoelectric point is 6.75
Get precalculated fractions of proteins
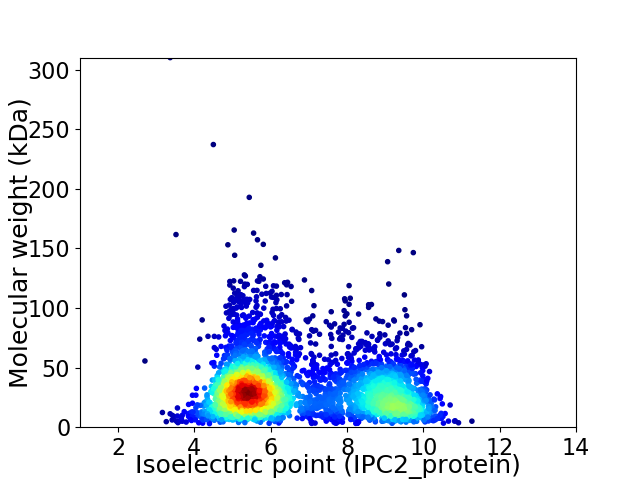
Virtual 2D-PAGE plot for 3738 proteins (isoelectric point calculated using IPC2_protein)
Get csv file with sequences according to given criteria:
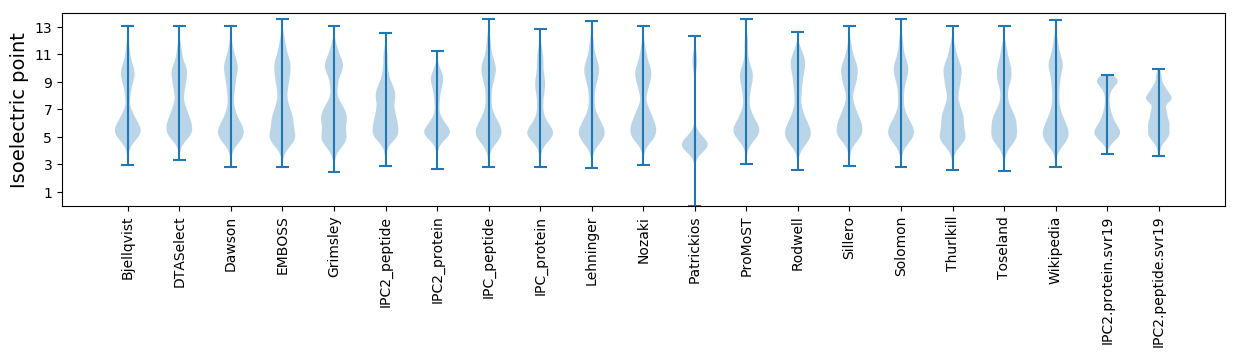
* You can choose from 21 different methods for calculating isoelectric point
Summary statistics related to proteome-wise predictions
Protein with the lowest isoelectric point:
>tr|A0A1G7R2A9|A0A1G7R2A9_9SPHN Lytic murein transglycosylase OS=Sphingomonas carotinifaciens OX=1166323 GN=SAMN05216557_11017 PE=4 SV=1
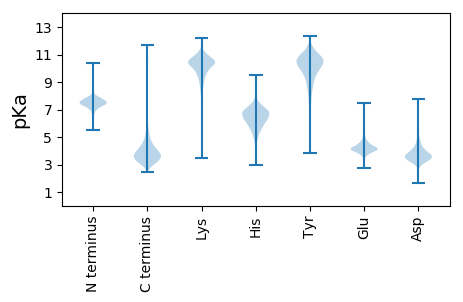
MM1 pKa = 7.74KK2 pKa = 10.3ILVLASASVLAFATPALAQTVSNQSYY28 pKa = 8.56VQQIGNEE35 pKa = 3.8NAATVLQNDD44 pKa = 4.31DD45 pKa = 4.2TNVSQIFQASSNDD58 pKa = 3.45TALVEE63 pKa = 4.09MSGGNNQSLVLQQKK77 pKa = 8.45TDD79 pKa = 3.9FVSGRR84 pKa = 11.84NDD86 pKa = 3.02SQTRR90 pKa = 11.84MSGYY94 pKa = 9.89NGTSITSQSGEE105 pKa = 3.78GNYY108 pKa = 11.04ANVTFSPASGDD119 pKa = 3.61SSSLIMQDD127 pKa = 2.92GKK129 pKa = 11.5GNEE132 pKa = 4.51AIVASGDD139 pKa = 3.0WGNASVITQTFDD151 pKa = 2.78EE152 pKa = 5.17NYY154 pKa = 10.73ANVYY158 pKa = 8.93QDD160 pKa = 3.22GYY162 pKa = 10.04NNVSVVVQDD171 pKa = 4.12GLANTANVTQHH182 pKa = 5.92
MM1 pKa = 7.74KK2 pKa = 10.3ILVLASASVLAFATPALAQTVSNQSYY28 pKa = 8.56VQQIGNEE35 pKa = 3.8NAATVLQNDD44 pKa = 4.31DD45 pKa = 4.2TNVSQIFQASSNDD58 pKa = 3.45TALVEE63 pKa = 4.09MSGGNNQSLVLQQKK77 pKa = 8.45TDD79 pKa = 3.9FVSGRR84 pKa = 11.84NDD86 pKa = 3.02SQTRR90 pKa = 11.84MSGYY94 pKa = 9.89NGTSITSQSGEE105 pKa = 3.78GNYY108 pKa = 11.04ANVTFSPASGDD119 pKa = 3.61SSSLIMQDD127 pKa = 2.92GKK129 pKa = 11.5GNEE132 pKa = 4.51AIVASGDD139 pKa = 3.0WGNASVITQTFDD151 pKa = 2.78EE152 pKa = 5.17NYY154 pKa = 10.73ANVYY158 pKa = 8.93QDD160 pKa = 3.22GYY162 pKa = 10.04NNVSVVVQDD171 pKa = 4.12GLANTANVTQHH182 pKa = 5.92
Molecular weight: 19.11 kDa
Isoelectric point according different methods:
Protein with the highest isoelectric point:
>tr|A0A1G7EVF1|A0A1G7EVF1_9SPHN Murein hydrolase A OS=Sphingomonas carotinifaciens OX=1166323 GN=GGR49_001348 PE=4 SV=1
MM1 pKa = 7.45KK2 pKa = 9.61RR3 pKa = 11.84TFQPSNLVRR12 pKa = 11.84ARR14 pKa = 11.84RR15 pKa = 11.84HH16 pKa = 4.58GFRR19 pKa = 11.84SRR21 pKa = 11.84MATPGGRR28 pKa = 11.84AVIRR32 pKa = 11.84ARR34 pKa = 11.84RR35 pKa = 11.84ARR37 pKa = 11.84GRR39 pKa = 11.84KK40 pKa = 9.02KK41 pKa = 10.61LSAA44 pKa = 4.03
MM1 pKa = 7.45KK2 pKa = 9.61RR3 pKa = 11.84TFQPSNLVRR12 pKa = 11.84ARR14 pKa = 11.84RR15 pKa = 11.84HH16 pKa = 4.58GFRR19 pKa = 11.84SRR21 pKa = 11.84MATPGGRR28 pKa = 11.84AVIRR32 pKa = 11.84ARR34 pKa = 11.84RR35 pKa = 11.84ARR37 pKa = 11.84GRR39 pKa = 11.84KK40 pKa = 9.02KK41 pKa = 10.61LSAA44 pKa = 4.03
Molecular weight: 5.06 kDa
Isoelectric point according different methods:
Peptides (in silico digests for buttom-up proteomics)
Below you can find in silico digests of the whole proteome with Trypsin, Chymotrypsin, Trypsin+LysC, LysN, ArgC proteases suitable for different mass spec machines.| Try ESI |
 |
|---|
| ChTry ESI |
|
|---|
| ArgC ESI |
|
|---|
| LysN ESI |
|
|---|
| TryLysC ESI |
|
|---|
| Try MALDI |
|
|---|
| ChTry MALDI |
|
|---|
| ArgC MALDI |
|
|---|
| LysN MALDI |
|
|---|
| TryLysC MALDI |
|
|---|
| Try LTQ |
|
|---|
| ChTry LTQ |
|
|---|
| ArgC LTQ |
|
|---|
| LysN LTQ |
|
|---|
| TryLysC LTQ |
|
|---|
| Try MSlow |
|
|---|
| ChTry MSlow |
|
|---|
| ArgC MSlow |
|
|---|
| LysN MSlow |
|
|---|
| TryLysC MSlow |
|
|---|
| Try MShigh |
|
|---|
| ChTry MShigh |
|
|---|
| ArgC MShigh |
|
|---|
| LysN MShigh |
|
|---|
| TryLysC MShigh |
|
|---|
General Statistics
Number of major isoforms |
Number of additional isoforms |
Number of all proteins |
Number of amino acids |
Min. Seq. Length |
Max. Seq. Length |
Avg. Seq. Length |
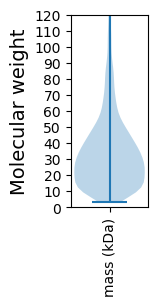
Avg. Mol. Weight |
|---|---|---|---|---|---|---|---|
0 |
1219373 |
29 |
3299 |
326.2 |
35.1 |
Amino acid frequency
Ala |
Cys |
Asp |
Glu |
Phe |
Gly |
His |
Ile |
Lys |
Leu |
|---|---|---|---|---|---|---|---|---|---|
14.081 ± 0.067 | 0.705 ± 0.011 |
6.092 ± 0.033 | 4.915 ± 0.036 |
3.393 ± 0.028 | 9.157 ± 0.047 |
1.99 ± 0.018 | 4.654 ± 0.024 |
2.405 ± 0.03 | 9.717 ± 0.052 |
Met |
Asn |
Gln |
Pro |
Arg |
Ser |
Thr |
Val |
Trp |
Tyr |
|---|---|---|---|---|---|---|---|---|---|
2.333 ± 0.021 | 2.419 ± 0.03 |
5.52 ± 0.033 | 3.073 ± 0.024 |
7.949 ± 0.041 | 4.795 ± 0.033 |
5.672 ± 0.043 | 7.488 ± 0.037 |
1.453 ± 0.02 | 2.189 ± 0.023 |
Most of the basic statistics you can see at this page can be downloaded from this CSV file
See this proteome in:

Proteome-pI is available under Creative Commons Attribution-NoDerivs license, for more details see here
| Reference: Kozlowski LP. Proteome-pI 2.0: Proteome Isoelectric Point Database Update. Nucleic Acids Res. 2021, doi: 10.1093/nar/gkab944 | Contact: Lukasz P. Kozlowski |