Pseudomonas resinovorans NBRC 106553
Taxonomy: cellular organisms; Bacteria; Proteobacteria; Gammaproteobacteria; Pseudomonadales; Pseudomonadaceae; Pseudomonas; Pseudomonas aeruginosa group; Pseudomonas resinovorans
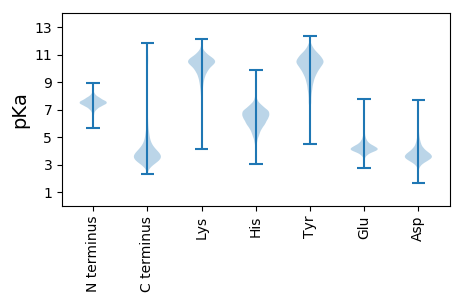
Average proteome isoelectric point is 6.3
Get precalculated fractions of proteins

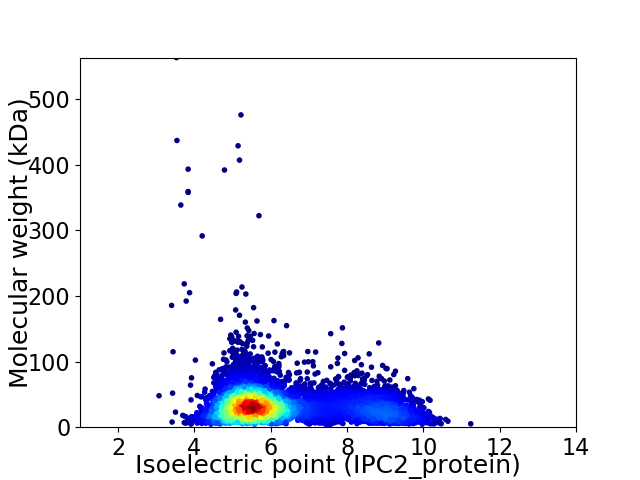
Virtual 2D-PAGE plot for 5795 proteins (isoelectric point calculated using IPC2_protein)
Get csv file with sequences according to given criteria:
* You can choose from 21 different methods for calculating isoelectric point
Summary statistics related to proteome-wise predictions


Protein with the lowest isoelectric point:
>tr|S6AKA0|S6AKA0_PSERE Phosphate-binding protein OS=Pseudomonas resinovorans NBRC 106553 OX=1245471 GN=pstS PE=3 SV=1
MM1 pKa = 7.3TLFRR5 pKa = 11.84SSPLFLGAPLLGALLNAGPASADD28 pKa = 3.01SGQYY32 pKa = 10.11PNVGMDD38 pKa = 3.28YY39 pKa = 11.04DD40 pKa = 3.76ATFQYY45 pKa = 11.32DD46 pKa = 3.65FTRR49 pKa = 11.84ADD51 pKa = 3.12HH52 pKa = 5.84STPGTSRR59 pKa = 11.84TTTDD63 pKa = 3.89GYY65 pKa = 10.42PDD67 pKa = 3.39INATFYY73 pKa = 11.24LRR75 pKa = 11.84FSTDD79 pKa = 2.97SQIHH83 pKa = 5.86LTTEE87 pKa = 4.43LNPINPPNDD96 pKa = 3.56GEE98 pKa = 4.55DD99 pKa = 3.12RR100 pKa = 11.84FFEE103 pKa = 4.76DD104 pKa = 4.1VGLQVNEE111 pKa = 4.28LAYY114 pKa = 10.29DD115 pKa = 4.01YY116 pKa = 11.17QSSRR120 pKa = 11.84YY121 pKa = 9.12SFSLGLVQVPIGRR134 pKa = 11.84AQDD137 pKa = 3.69AAPGLYY143 pKa = 9.88TSDD146 pKa = 3.47FVAVYY151 pKa = 10.39DD152 pKa = 4.31LDD154 pKa = 4.56GMLGGTFAYY163 pKa = 10.26RR164 pKa = 11.84FFGDD168 pKa = 3.22QLGVIEE174 pKa = 4.93TDD176 pKa = 3.04LTLYY180 pKa = 10.62RR181 pKa = 11.84QDD183 pKa = 3.05TSVLSRR189 pKa = 11.84PYY191 pKa = 9.69FQSGQQVDD199 pKa = 3.97RR200 pKa = 11.84NDD202 pKa = 3.72GGPANNGKK210 pKa = 9.73INSYY214 pKa = 10.37AVAVNWLAIPALPFLEE230 pKa = 4.47LQAGQMRR237 pKa = 11.84NQGGDD242 pKa = 3.1FDD244 pKa = 5.32GVDD247 pKa = 3.72GSADD251 pKa = 3.61DD252 pKa = 4.28EE253 pKa = 4.89VVNLASLRR261 pKa = 11.84YY262 pKa = 8.35IYY264 pKa = 10.36AVPRR268 pKa = 11.84STDD271 pKa = 3.05LDD273 pKa = 3.89TTLSGQYY280 pKa = 10.32LDD282 pKa = 3.41VVPFIEE288 pKa = 4.67YY289 pKa = 10.82ADD291 pKa = 3.73VDD293 pKa = 3.96NEE295 pKa = 4.18GAIPGNDD302 pKa = 2.99TRR304 pKa = 11.84YY305 pKa = 8.68LTTSLTLDD313 pKa = 3.25YY314 pKa = 10.93GLWAFGLTRR323 pKa = 11.84TDD325 pKa = 2.61KK326 pKa = 10.8RR327 pKa = 11.84RR328 pKa = 11.84PNDD331 pKa = 3.31TGGGDD336 pKa = 3.1THH338 pKa = 7.55DD339 pKa = 4.23YY340 pKa = 11.22LNEE343 pKa = 3.98LSVTYY348 pKa = 10.75ALTGQLSIGVSAGTQKK364 pKa = 10.66QDD366 pKa = 3.45GEE368 pKa = 4.25NDD370 pKa = 3.67NILGLAITYY379 pKa = 10.41SGGYY383 pKa = 8.85
MM1 pKa = 7.3TLFRR5 pKa = 11.84SSPLFLGAPLLGALLNAGPASADD28 pKa = 3.01SGQYY32 pKa = 10.11PNVGMDD38 pKa = 3.28YY39 pKa = 11.04DD40 pKa = 3.76ATFQYY45 pKa = 11.32DD46 pKa = 3.65FTRR49 pKa = 11.84ADD51 pKa = 3.12HH52 pKa = 5.84STPGTSRR59 pKa = 11.84TTTDD63 pKa = 3.89GYY65 pKa = 10.42PDD67 pKa = 3.39INATFYY73 pKa = 11.24LRR75 pKa = 11.84FSTDD79 pKa = 2.97SQIHH83 pKa = 5.86LTTEE87 pKa = 4.43LNPINPPNDD96 pKa = 3.56GEE98 pKa = 4.55DD99 pKa = 3.12RR100 pKa = 11.84FFEE103 pKa = 4.76DD104 pKa = 4.1VGLQVNEE111 pKa = 4.28LAYY114 pKa = 10.29DD115 pKa = 4.01YY116 pKa = 11.17QSSRR120 pKa = 11.84YY121 pKa = 9.12SFSLGLVQVPIGRR134 pKa = 11.84AQDD137 pKa = 3.69AAPGLYY143 pKa = 9.88TSDD146 pKa = 3.47FVAVYY151 pKa = 10.39DD152 pKa = 4.31LDD154 pKa = 4.56GMLGGTFAYY163 pKa = 10.26RR164 pKa = 11.84FFGDD168 pKa = 3.22QLGVIEE174 pKa = 4.93TDD176 pKa = 3.04LTLYY180 pKa = 10.62RR181 pKa = 11.84QDD183 pKa = 3.05TSVLSRR189 pKa = 11.84PYY191 pKa = 9.69FQSGQQVDD199 pKa = 3.97RR200 pKa = 11.84NDD202 pKa = 3.72GGPANNGKK210 pKa = 9.73INSYY214 pKa = 10.37AVAVNWLAIPALPFLEE230 pKa = 4.47LQAGQMRR237 pKa = 11.84NQGGDD242 pKa = 3.1FDD244 pKa = 5.32GVDD247 pKa = 3.72GSADD251 pKa = 3.61DD252 pKa = 4.28EE253 pKa = 4.89VVNLASLRR261 pKa = 11.84YY262 pKa = 8.35IYY264 pKa = 10.36AVPRR268 pKa = 11.84STDD271 pKa = 3.05LDD273 pKa = 3.89TTLSGQYY280 pKa = 10.32LDD282 pKa = 3.41VVPFIEE288 pKa = 4.67YY289 pKa = 10.82ADD291 pKa = 3.73VDD293 pKa = 3.96NEE295 pKa = 4.18GAIPGNDD302 pKa = 2.99TRR304 pKa = 11.84YY305 pKa = 8.68LTTSLTLDD313 pKa = 3.25YY314 pKa = 10.93GLWAFGLTRR323 pKa = 11.84TDD325 pKa = 2.61KK326 pKa = 10.8RR327 pKa = 11.84RR328 pKa = 11.84PNDD331 pKa = 3.31TGGGDD336 pKa = 3.1THH338 pKa = 7.55DD339 pKa = 4.23YY340 pKa = 11.22LNEE343 pKa = 3.98LSVTYY348 pKa = 10.75ALTGQLSIGVSAGTQKK364 pKa = 10.66QDD366 pKa = 3.45GEE368 pKa = 4.25NDD370 pKa = 3.67NILGLAITYY379 pKa = 10.41SGGYY383 pKa = 8.85
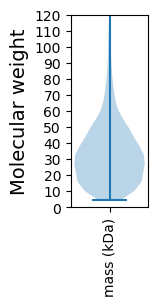
Molecular weight: 41.65 kDa
Isoelectric point according different methods:
Protein with the highest isoelectric point:
>tr|S6ABZ8|S6ABZ8_PSERE Dihydrofolate reductase OS=Pseudomonas resinovorans NBRC 106553 OX=1245471 GN=folA PE=3 SV=1
MM1 pKa = 7.45KK2 pKa = 9.56RR3 pKa = 11.84TFQPSTIKK11 pKa = 10.52RR12 pKa = 11.84ARR14 pKa = 11.84THH16 pKa = 5.94GFRR19 pKa = 11.84ARR21 pKa = 11.84MATKK25 pKa = 10.16NGRR28 pKa = 11.84AVLSRR33 pKa = 11.84RR34 pKa = 11.84RR35 pKa = 11.84AKK37 pKa = 9.83GRR39 pKa = 11.84KK40 pKa = 8.88RR41 pKa = 11.84LTVV44 pKa = 3.11
MM1 pKa = 7.45KK2 pKa = 9.56RR3 pKa = 11.84TFQPSTIKK11 pKa = 10.52RR12 pKa = 11.84ARR14 pKa = 11.84THH16 pKa = 5.94GFRR19 pKa = 11.84ARR21 pKa = 11.84MATKK25 pKa = 10.16NGRR28 pKa = 11.84AVLSRR33 pKa = 11.84RR34 pKa = 11.84RR35 pKa = 11.84AKK37 pKa = 9.83GRR39 pKa = 11.84KK40 pKa = 8.88RR41 pKa = 11.84LTVV44 pKa = 3.11
Molecular weight: 5.15 kDa
Isoelectric point according different methods:
Peptides (in silico digests for buttom-up proteomics)
Below you can find in silico digests of the whole proteome with Trypsin, Chymotrypsin, Trypsin+LysC, LysN, ArgC proteases suitable for different mass spec machines.| Try ESI |
 |
|---|
| ChTry ESI |
 |
|---|
| ArgC ESI |
 |
|---|
| LysN ESI |
 |
|---|
| TryLysC ESI |
 |
|---|
| Try MALDI |
 |
|---|
| ChTry MALDI |
 |
|---|
| ArgC MALDI |
 |
|---|
| LysN MALDI |
 |
|---|
| TryLysC MALDI |
 |
|---|
| Try LTQ |
 |
|---|
| ChTry LTQ |
 |
|---|
| ArgC LTQ |
 |
|---|
| LysN LTQ |
 |
|---|
| TryLysC LTQ |
 |
|---|
| Try MSlow |
 |
|---|
| ChTry MSlow |
 |
|---|
| ArgC MSlow |
 |
|---|
| LysN MSlow |
 |
|---|
| TryLysC MSlow |
 |
|---|
| Try MShigh |
 |
|---|
| ChTry MShigh |
 |
|---|
| ArgC MShigh |
 |
|---|
| LysN MShigh |
 |
|---|
| TryLysC MShigh |
 |
|---|
General Statistics
Number of major isoforms |
Number of additional isoforms |
Number of all proteins |
Number of amino acids |
Min. Seq. Length |
Max. Seq. Length |
Avg. Seq. Length |
Avg. Mol. Weight |
|---|---|---|---|---|---|---|---|
0 |
1892167 |
43 |
5569 |
326.5 |
35.73 |
Amino acid frequency
Ala |
Cys |
Asp |
Glu |
Phe |
Gly |
His |
Ile |
Lys |
Leu |
|---|---|---|---|---|---|---|---|---|---|
11.405 ± 0.046 | 0.983 ± 0.013 |
5.44 ± 0.031 | 5.952 ± 0.038 |
3.645 ± 0.023 | 8.401 ± 0.044 |
2.195 ± 0.018 | 4.456 ± 0.026 |
3.151 ± 0.029 | 11.987 ± 0.053 |
Met |
Asn |
Gln |
Pro |
Arg |
Ser |
Thr |
Val |
Trp |
Tyr |
|---|---|---|---|---|---|---|---|---|---|
2.249 ± 0.021 | 2.896 ± 0.036 |
4.956 ± 0.027 | 4.327 ± 0.027 |
6.83 ± 0.045 | 5.524 ± 0.033 |
4.582 ± 0.048 | 7.083 ± 0.027 |
1.437 ± 0.015 | 2.501 ± 0.017 |
Most of the basic statistics you can see at this page can be downloaded from this CSV file
Proteome-pI is available under Creative Commons Attribution-NoDerivs license, for more details see here
| Reference: Kozlowski LP. Proteome-pI 2.0: Proteome Isoelectric Point Database Update. Nucleic Acids Res. 2021, doi: 10.1093/nar/gkab944 | Contact: Lukasz P. Kozlowski |
