Nocardia cerradoensis
Taxonomy: cellular organisms; Bacteria; Terrabacteria group; Actinobacteria; Actinomycetia; Corynebacteriales; Nocardiaceae; Nocardia
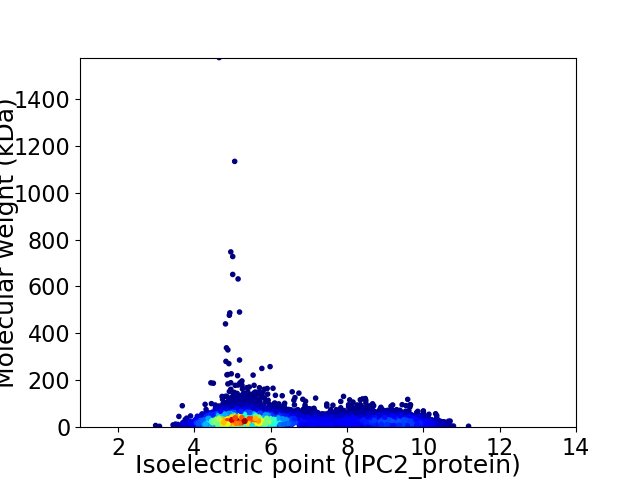
Average proteome isoelectric point is 6.16
Get precalculated fractions of proteins

Virtual 2D-PAGE plot for 8308 proteins (isoelectric point calculated using IPC2_protein)
Get csv file with sequences according to given criteria:
* You can choose from 21 different methods for calculating isoelectric point
Summary statistics related to proteome-wise predictions


Protein with the lowest isoelectric point:
>tr|A0A231HE19|A0A231HE19_9NOCA Uncharacterized protein OS=Nocardia cerradoensis OX=85688 GN=B7C42_00221 PE=4 SV=1
MM1 pKa = 8.03CDD3 pKa = 3.02RR4 pKa = 11.84TPRR7 pKa = 11.84QGPRR11 pKa = 11.84SPGFAIAIVAVEE23 pKa = 3.97VVVRR27 pKa = 11.84GRR29 pKa = 11.84FSPGTPPLFRR39 pKa = 11.84GDD41 pKa = 3.61SSPTLTGPSVRR52 pKa = 11.84SVCPMVGLTKK62 pKa = 10.58SLALPTSAQPGGDD75 pKa = 3.33TPGWSGVVGVSVFGIGPVIPGWPSWSVSGGADD107 pKa = 3.26GSGGTGAGGGAGVCDD122 pKa = 3.9WGGADD127 pKa = 4.36ADD129 pKa = 4.11GSGDD133 pKa = 3.63CGAGGGVGVGDD144 pKa = 3.58WSGGANVDD152 pKa = 4.46GPGDD156 pKa = 3.73CAAGGGVGVGDD167 pKa = 3.54WGGGADD173 pKa = 3.74ADD175 pKa = 4.41GSGEE179 pKa = 4.15CGAGMSEE186 pKa = 4.24GGAAGAAGAGVTGGAACGSDD206 pKa = 3.1VGGAGGGTEE215 pKa = 4.62LSGPDD220 pKa = 3.55GAGGCVGSGEE230 pKa = 4.25VGAEE234 pKa = 3.92EE235 pKa = 4.08VGGAGVGAGPGSCVGAPGAGADD257 pKa = 3.92EE258 pKa = 5.13LGAGSPGVGAGCVWGGAGAGLAGAGAGAGAGAGAGAGAGGDD299 pKa = 3.71CGVAGVPGTVAEE311 pKa = 4.37LGAWSGVAGSDD322 pKa = 3.58SDD324 pKa = 4.74DD325 pKa = 3.79GGAVGLWSACGRR337 pKa = 11.84SPFGRR342 pKa = 11.84AGALGRR348 pKa = 11.84GPAGSACAGGSGSAGTAVPAAEE370 pKa = 4.01
MM1 pKa = 8.03CDD3 pKa = 3.02RR4 pKa = 11.84TPRR7 pKa = 11.84QGPRR11 pKa = 11.84SPGFAIAIVAVEE23 pKa = 3.97VVVRR27 pKa = 11.84GRR29 pKa = 11.84FSPGTPPLFRR39 pKa = 11.84GDD41 pKa = 3.61SSPTLTGPSVRR52 pKa = 11.84SVCPMVGLTKK62 pKa = 10.58SLALPTSAQPGGDD75 pKa = 3.33TPGWSGVVGVSVFGIGPVIPGWPSWSVSGGADD107 pKa = 3.26GSGGTGAGGGAGVCDD122 pKa = 3.9WGGADD127 pKa = 4.36ADD129 pKa = 4.11GSGDD133 pKa = 3.63CGAGGGVGVGDD144 pKa = 3.58WSGGANVDD152 pKa = 4.46GPGDD156 pKa = 3.73CAAGGGVGVGDD167 pKa = 3.54WGGGADD173 pKa = 3.74ADD175 pKa = 4.41GSGEE179 pKa = 4.15CGAGMSEE186 pKa = 4.24GGAAGAAGAGVTGGAACGSDD206 pKa = 3.1VGGAGGGTEE215 pKa = 4.62LSGPDD220 pKa = 3.55GAGGCVGSGEE230 pKa = 4.25VGAEE234 pKa = 3.92EE235 pKa = 4.08VGGAGVGAGPGSCVGAPGAGADD257 pKa = 3.92EE258 pKa = 5.13LGAGSPGVGAGCVWGGAGAGLAGAGAGAGAGAGAGAGAGGDD299 pKa = 3.71CGVAGVPGTVAEE311 pKa = 4.37LGAWSGVAGSDD322 pKa = 3.58SDD324 pKa = 4.74DD325 pKa = 3.79GGAVGLWSACGRR337 pKa = 11.84SPFGRR342 pKa = 11.84AGALGRR348 pKa = 11.84GPAGSACAGGSGSAGTAVPAAEE370 pKa = 4.01
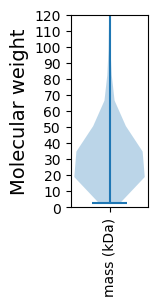
Molecular weight: 32.34 kDa
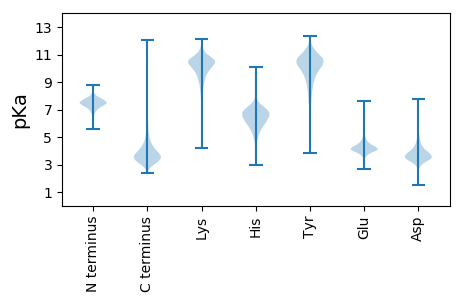
Isoelectric point according different methods:
Protein with the highest isoelectric point:
>tr|A0A231H4K3|A0A231H4K3_9NOCA DUF4189 domain-containing protein OS=Nocardia cerradoensis OX=85688 GN=B7C42_04514 PE=4 SV=1
MM1 pKa = 7.4GSVIKK6 pKa = 10.38KK7 pKa = 8.42RR8 pKa = 11.84RR9 pKa = 11.84KK10 pKa = 9.06RR11 pKa = 11.84MSKK14 pKa = 9.76KK15 pKa = 9.54KK16 pKa = 9.72HH17 pKa = 5.63RR18 pKa = 11.84KK19 pKa = 7.56LLRR22 pKa = 11.84RR23 pKa = 11.84TRR25 pKa = 11.84VQRR28 pKa = 11.84RR29 pKa = 11.84KK30 pKa = 10.11LGKK33 pKa = 9.87
MM1 pKa = 7.4GSVIKK6 pKa = 10.38KK7 pKa = 8.42RR8 pKa = 11.84RR9 pKa = 11.84KK10 pKa = 9.06RR11 pKa = 11.84MSKK14 pKa = 9.76KK15 pKa = 9.54KK16 pKa = 9.72HH17 pKa = 5.63RR18 pKa = 11.84KK19 pKa = 7.56LLRR22 pKa = 11.84RR23 pKa = 11.84TRR25 pKa = 11.84VQRR28 pKa = 11.84RR29 pKa = 11.84KK30 pKa = 10.11LGKK33 pKa = 9.87
Molecular weight: 4.15 kDa
Isoelectric point according different methods:
Peptides (in silico digests for buttom-up proteomics)
Below you can find in silico digests of the whole proteome with Trypsin, Chymotrypsin, Trypsin+LysC, LysN, ArgC proteases suitable for different mass spec machines.| Try ESI |
 |
|---|
| ChTry ESI |
 |
|---|
| ArgC ESI |
 |
|---|
| LysN ESI |
 |
|---|
| TryLysC ESI |
 |
|---|
| Try MALDI |
 |
|---|
| ChTry MALDI |
 |
|---|
| ArgC MALDI |
 |
|---|
| LysN MALDI |
 |
|---|
| TryLysC MALDI |
 |
|---|
| Try LTQ |
 |
|---|
| ChTry LTQ |
 |
|---|
| ArgC LTQ |
 |
|---|
| LysN LTQ |
 |
|---|
| TryLysC LTQ |
 |
|---|
| Try MSlow |
 |
|---|
| ChTry MSlow |
 |
|---|
| ArgC MSlow |
 |
|---|
| LysN MSlow |
 |
|---|
| TryLysC MSlow |
 |
|---|
| Try MShigh |
 |
|---|
| ChTry MShigh |
 |
|---|
| ArgC MShigh |
 |
|---|
| LysN MShigh |
 |
|---|
| TryLysC MShigh |
 |
|---|
General Statistics
Number of major isoforms |
Number of additional isoforms |
Number of all proteins |
Number of amino acids |
Min. Seq. Length |
Max. Seq. Length |
Avg. Seq. Length |
Avg. Mol. Weight |
|---|---|---|---|---|---|---|---|
0 |
2632396 |
29 |
14660 |
316.9 |
34.02 |
Amino acid frequency
Ala |
Cys |
Asp |
Glu |
Phe |
Gly |
His |
Ile |
Lys |
Leu |
|---|---|---|---|---|---|---|---|---|---|
13.493 ± 0.037 | 0.79 ± 0.009 |
6.28 ± 0.025 | 5.401 ± 0.022 |
2.898 ± 0.016 | 8.927 ± 0.035 |
2.342 ± 0.014 | 4.137 ± 0.017 |
1.849 ± 0.02 | 9.773 ± 0.034 |
Met |
Asn |
Gln |
Pro |
Arg |
Ser |
Thr |
Val |
Trp |
Tyr |
|---|---|---|---|---|---|---|---|---|---|
1.889 ± 0.011 | 1.981 ± 0.014 |
5.985 ± 0.028 | 2.886 ± 0.018 |
7.994 ± 0.032 | 5.247 ± 0.019 |
6.144 ± 0.024 | 8.428 ± 0.031 |
1.478 ± 0.012 | 2.075 ± 0.014 |
Most of the basic statistics you can see at this page can be downloaded from this CSV file
Proteome-pI is available under Creative Commons Attribution-NoDerivs license, for more details see here
| Reference: Kozlowski LP. Proteome-pI 2.0: Proteome Isoelectric Point Database Update. Nucleic Acids Res. 2021, doi: 10.1093/nar/gkab944 | Contact: Lukasz P. Kozlowski |
