Halomonas sp. A11-A
Taxonomy: cellular organisms; Bacteria; Proteobacteria; Gammaproteobacteria; Oceanospirillales; Halomonadaceae; Halomonas; unclassified Halomonas
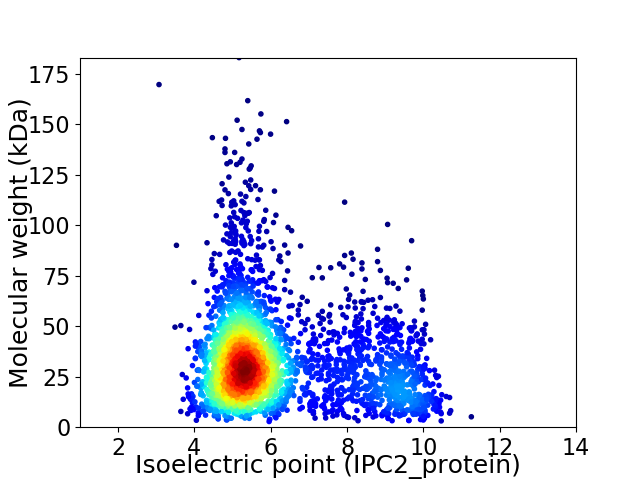
Average proteome isoelectric point is 6.21
Get precalculated fractions of proteins

Virtual 2D-PAGE plot for 3109 proteins (isoelectric point calculated using IPC2_protein)
Get csv file with sequences according to given criteria:
* You can choose from 21 different methods for calculating isoelectric point
Summary statistics related to proteome-wise predictions


Protein with the lowest isoelectric point:
>tr|A0A317NLK3|A0A317NLK3_9GAMM Amino acid ABC transporter substrate-binding protein (PAAT family) OS=Halomonas sp. A11-A OX=2183985 GN=DER72_10938 PE=3 SV=1
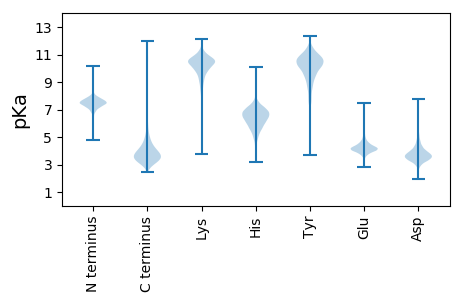
MM1 pKa = 7.62ILFPPLKK8 pKa = 8.91TLAAAVLVATSGFAVSSAQAEE29 pKa = 4.21DD30 pKa = 4.6FYY32 pKa = 11.47SGKK35 pKa = 7.74TLEE38 pKa = 4.35VVVPFGEE45 pKa = 4.9GGATYY50 pKa = 10.49VAAKK54 pKa = 9.94FLEE57 pKa = 4.57PFLEE61 pKa = 4.05KK62 pKa = 10.34HH63 pKa = 6.16LPGNPQVNVRR73 pKa = 11.84TRR75 pKa = 11.84PGGGSILGANWFQQNAEE92 pKa = 4.26PDD94 pKa = 3.64GEE96 pKa = 4.6TILFTTSSTSNPYY109 pKa = 9.55VLGMDD114 pKa = 3.21AVEE117 pKa = 4.2YY118 pKa = 10.54DD119 pKa = 4.01LAAMRR124 pKa = 11.84PAYY127 pKa = 9.87SLPFGAVIYY136 pKa = 8.44VSPRR140 pKa = 11.84TGIEE144 pKa = 3.76SSADD148 pKa = 3.22LHH150 pKa = 8.04SPDD153 pKa = 3.18TTLIYY158 pKa = 10.8GGIAAAASDD167 pKa = 4.63LPVLLAFEE175 pKa = 4.88LLEE178 pKa = 5.27LDD180 pKa = 3.7LRR182 pKa = 11.84AVLGFDD188 pKa = 3.19GRR190 pKa = 11.84GPARR194 pKa = 11.84LAFEE198 pKa = 4.57RR199 pKa = 11.84GEE201 pKa = 4.29TNIDD205 pKa = 3.65FQFTPAYY212 pKa = 8.04MSQVVDD218 pKa = 3.67MVEE221 pKa = 4.04AGSAVPIMSAGSVGDD236 pKa = 4.26DD237 pKa = 3.18GVLSARR243 pKa = 11.84DD244 pKa = 3.76LAFPDD249 pKa = 3.93YY250 pKa = 8.27PTVYY254 pKa = 9.81EE255 pKa = 4.52VYY257 pKa = 10.06EE258 pKa = 4.08EE259 pKa = 5.23LYY261 pKa = 10.88GEE263 pKa = 4.46PPSGVEE269 pKa = 3.15WDD271 pKa = 3.29AFQAIGATTFNFGLTAYY288 pKa = 9.89LPEE291 pKa = 4.42GTPDD295 pKa = 3.16EE296 pKa = 4.21VVEE299 pKa = 4.59IFEE302 pKa = 4.07QTIAAINDD310 pKa = 3.49DD311 pKa = 4.29PDD313 pKa = 3.68YY314 pKa = 11.39QEE316 pKa = 4.29QSQDD320 pKa = 3.41AIGGYY325 pKa = 10.43DD326 pKa = 4.68LLPASAVTDD335 pKa = 3.82SLSEE339 pKa = 3.9ALQPSDD345 pKa = 3.64EE346 pKa = 4.21VRR348 pKa = 11.84DD349 pKa = 3.83YY350 pKa = 11.71LRR352 pKa = 11.84TLLSEE357 pKa = 4.47KK358 pKa = 10.74YY359 pKa = 10.18DD360 pKa = 3.6VEE362 pKa = 4.29LL363 pKa = 5.22
MM1 pKa = 7.62ILFPPLKK8 pKa = 8.91TLAAAVLVATSGFAVSSAQAEE29 pKa = 4.21DD30 pKa = 4.6FYY32 pKa = 11.47SGKK35 pKa = 7.74TLEE38 pKa = 4.35VVVPFGEE45 pKa = 4.9GGATYY50 pKa = 10.49VAAKK54 pKa = 9.94FLEE57 pKa = 4.57PFLEE61 pKa = 4.05KK62 pKa = 10.34HH63 pKa = 6.16LPGNPQVNVRR73 pKa = 11.84TRR75 pKa = 11.84PGGGSILGANWFQQNAEE92 pKa = 4.26PDD94 pKa = 3.64GEE96 pKa = 4.6TILFTTSSTSNPYY109 pKa = 9.55VLGMDD114 pKa = 3.21AVEE117 pKa = 4.2YY118 pKa = 10.54DD119 pKa = 4.01LAAMRR124 pKa = 11.84PAYY127 pKa = 9.87SLPFGAVIYY136 pKa = 8.44VSPRR140 pKa = 11.84TGIEE144 pKa = 3.76SSADD148 pKa = 3.22LHH150 pKa = 8.04SPDD153 pKa = 3.18TTLIYY158 pKa = 10.8GGIAAAASDD167 pKa = 4.63LPVLLAFEE175 pKa = 4.88LLEE178 pKa = 5.27LDD180 pKa = 3.7LRR182 pKa = 11.84AVLGFDD188 pKa = 3.19GRR190 pKa = 11.84GPARR194 pKa = 11.84LAFEE198 pKa = 4.57RR199 pKa = 11.84GEE201 pKa = 4.29TNIDD205 pKa = 3.65FQFTPAYY212 pKa = 8.04MSQVVDD218 pKa = 3.67MVEE221 pKa = 4.04AGSAVPIMSAGSVGDD236 pKa = 4.26DD237 pKa = 3.18GVLSARR243 pKa = 11.84DD244 pKa = 3.76LAFPDD249 pKa = 3.93YY250 pKa = 8.27PTVYY254 pKa = 9.81EE255 pKa = 4.52VYY257 pKa = 10.06EE258 pKa = 4.08EE259 pKa = 5.23LYY261 pKa = 10.88GEE263 pKa = 4.46PPSGVEE269 pKa = 3.15WDD271 pKa = 3.29AFQAIGATTFNFGLTAYY288 pKa = 9.89LPEE291 pKa = 4.42GTPDD295 pKa = 3.16EE296 pKa = 4.21VVEE299 pKa = 4.59IFEE302 pKa = 4.07QTIAAINDD310 pKa = 3.49DD311 pKa = 4.29PDD313 pKa = 3.68YY314 pKa = 11.39QEE316 pKa = 4.29QSQDD320 pKa = 3.41AIGGYY325 pKa = 10.43DD326 pKa = 4.68LLPASAVTDD335 pKa = 3.82SLSEE339 pKa = 3.9ALQPSDD345 pKa = 3.64EE346 pKa = 4.21VRR348 pKa = 11.84DD349 pKa = 3.83YY350 pKa = 11.71LRR352 pKa = 11.84TLLSEE357 pKa = 4.47KK358 pKa = 10.74YY359 pKa = 10.18DD360 pKa = 3.6VEE362 pKa = 4.29LL363 pKa = 5.22
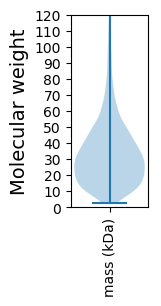
Molecular weight: 38.85 kDa
Isoelectric point according different methods:
Protein with the highest isoelectric point:
>tr|A0A317NU69|A0A317NU69_9GAMM ATP synthase epsilon chain OS=Halomonas sp. A11-A OX=2183985 GN=atpC PE=3 SV=1
MM1 pKa = 7.45KK2 pKa = 9.51RR3 pKa = 11.84TFQPSVLKK11 pKa = 10.34RR12 pKa = 11.84KK13 pKa = 9.1RR14 pKa = 11.84VHH16 pKa = 6.26GFRR19 pKa = 11.84ARR21 pKa = 11.84MATKK25 pKa = 10.3NGRR28 pKa = 11.84AVLARR33 pKa = 11.84RR34 pKa = 11.84RR35 pKa = 11.84AKK37 pKa = 9.93GRR39 pKa = 11.84KK40 pKa = 8.85RR41 pKa = 11.84LSAA44 pKa = 3.96
MM1 pKa = 7.45KK2 pKa = 9.51RR3 pKa = 11.84TFQPSVLKK11 pKa = 10.34RR12 pKa = 11.84KK13 pKa = 9.1RR14 pKa = 11.84VHH16 pKa = 6.26GFRR19 pKa = 11.84ARR21 pKa = 11.84MATKK25 pKa = 10.3NGRR28 pKa = 11.84AVLARR33 pKa = 11.84RR34 pKa = 11.84RR35 pKa = 11.84AKK37 pKa = 9.93GRR39 pKa = 11.84KK40 pKa = 8.85RR41 pKa = 11.84LSAA44 pKa = 3.96
Molecular weight: 5.15 kDa
Isoelectric point according different methods:
Peptides (in silico digests for buttom-up proteomics)
Below you can find in silico digests of the whole proteome with Trypsin, Chymotrypsin, Trypsin+LysC, LysN, ArgC proteases suitable for different mass spec machines.| Try ESI |
 |
|---|
| ChTry ESI |
 |
|---|
| ArgC ESI |
 |
|---|
| LysN ESI |
 |
|---|
| TryLysC ESI |
 |
|---|
| Try MALDI |
 |
|---|
| ChTry MALDI |
 |
|---|
| ArgC MALDI |
 |
|---|
| LysN MALDI |
 |
|---|
| TryLysC MALDI |
 |
|---|
| Try LTQ |
 |
|---|
| ChTry LTQ |
 |
|---|
| ArgC LTQ |
 |
|---|
| LysN LTQ |
 |
|---|
| TryLysC LTQ |
 |
|---|
| Try MSlow |
 |
|---|
| ChTry MSlow |
 |
|---|
| ArgC MSlow |
 |
|---|
| LysN MSlow |
 |
|---|
| TryLysC MSlow |
 |
|---|
| Try MShigh |
 |
|---|
| ChTry MShigh |
 |
|---|
| ArgC MShigh |
 |
|---|
| LysN MShigh |
 |
|---|
| TryLysC MShigh |
 |
|---|
General Statistics
Number of major isoforms |
Number of additional isoforms |
Number of all proteins |
Number of amino acids |
Min. Seq. Length |
Max. Seq. Length |
Avg. Seq. Length |
Avg. Mol. Weight |
|---|---|---|---|---|---|---|---|
0 |
993874 |
26 |
1660 |
319.7 |
35.02 |
Amino acid frequency
Ala |
Cys |
Asp |
Glu |
Phe |
Gly |
His |
Ile |
Lys |
Leu |
|---|---|---|---|---|---|---|---|---|---|
11.99 ± 0.061 | 0.888 ± 0.015 |
5.452 ± 0.039 | 7.045 ± 0.049 |
3.346 ± 0.028 | 8.381 ± 0.036 |
2.415 ± 0.02 | 4.38 ± 0.034 |
2.506 ± 0.036 | 11.845 ± 0.062 |
Met |
Asn |
Gln |
Pro |
Arg |
Ser |
Thr |
Val |
Trp |
Tyr |
|---|---|---|---|---|---|---|---|---|---|
2.39 ± 0.024 | 2.254 ± 0.022 |
5.18 ± 0.037 | 3.587 ± 0.026 |
7.878 ± 0.048 | 4.92 ± 0.027 |
4.68 ± 0.028 | 7.225 ± 0.038 |
1.458 ± 0.021 | 2.179 ± 0.018 |
Most of the basic statistics you can see at this page can be downloaded from this CSV file
Proteome-pI is available under Creative Commons Attribution-NoDerivs license, for more details see here
| Reference: Kozlowski LP. Proteome-pI 2.0: Proteome Isoelectric Point Database Update. Nucleic Acids Res. 2021, doi: 10.1093/nar/gkab944 | Contact: Lukasz P. Kozlowski |
