Blackberry virus F
Taxonomy: Viruses; Riboviria; Pararnavirae; Artverviricota; Revtraviricetes; Ortervirales; Caulimoviridae; Badnavirus
Average proteome isoelectric point is 6.94
Get precalculated fractions of proteins

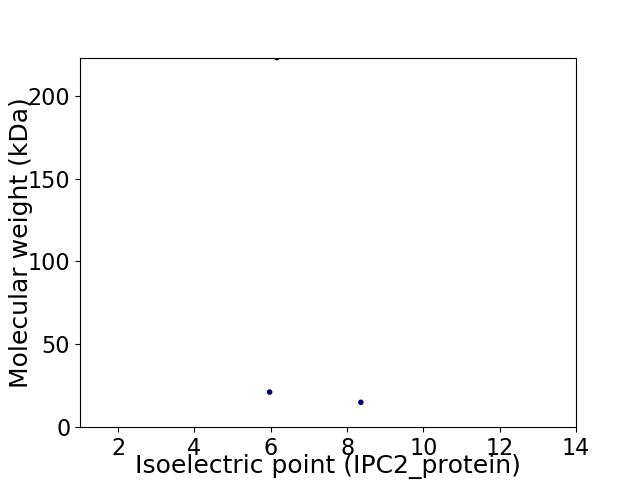
Virtual 2D-PAGE plot for 3 proteins (isoelectric point calculated using IPC2_protein)
Get csv file with sequences according to given criteria:
* You can choose from 21 different methods for calculating isoelectric point
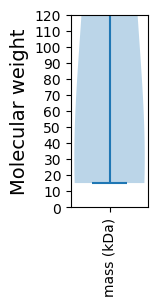
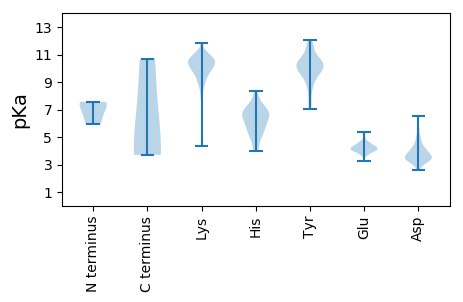
Summary statistics related to proteome-wise predictions


Protein with the lowest isoelectric point:
>tr|A0A0X8TLD2|A0A0X8TLD2_9VIRU Uncharacterized protein OS=Blackberry virus F OX=2560349 PE=4 SV=1
MM1 pKa = 5.96TAEE4 pKa = 5.27RR5 pKa = 11.84IEE7 pKa = 4.07QSIKK11 pKa = 11.0DD12 pKa = 3.45WDD14 pKa = 3.98DD15 pKa = 3.21KK16 pKa = 11.87YY17 pKa = 11.35KK18 pKa = 11.28VKK20 pKa = 10.93DD21 pKa = 3.58LDD23 pKa = 3.87YY24 pKa = 11.51LNLEE28 pKa = 4.41VPQPSSFQNLSSLGFFCFHH47 pKa = 6.17QNCKK51 pKa = 10.27HH52 pKa = 5.83SLEE55 pKa = 4.6SSSSQLNLLTDD66 pKa = 4.36LALVQHH72 pKa = 6.73LNLEE76 pKa = 4.64FTHH79 pKa = 6.43SRR81 pKa = 11.84VGLSARR87 pKa = 11.84IAIKK91 pKa = 10.35YY92 pKa = 7.02FHH94 pKa = 7.15SISNQLKK101 pKa = 9.0EE102 pKa = 4.35QEE104 pKa = 4.34EE105 pKa = 4.15QLKK108 pKa = 8.08TVAATQKK115 pKa = 10.55KK116 pKa = 8.78IQKK119 pKa = 7.96QLKK122 pKa = 8.31SLEE125 pKa = 4.46GEE127 pKa = 4.43LEE129 pKa = 3.73QHH131 pKa = 6.41RR132 pKa = 11.84PLSRR136 pKa = 11.84TDD138 pKa = 3.24VQQLVQEE145 pKa = 5.02IAQQPKK151 pKa = 10.15LVEE154 pKa = 4.21AEE156 pKa = 4.2ALRR159 pKa = 11.84LTQDD163 pKa = 3.5LEE165 pKa = 4.13RR166 pKa = 11.84RR167 pKa = 11.84LNEE170 pKa = 4.04VKK172 pKa = 10.68DD173 pKa = 3.67LLGEE177 pKa = 4.17VKK179 pKa = 10.36KK180 pKa = 10.97ALLSS184 pKa = 3.7
MM1 pKa = 5.96TAEE4 pKa = 5.27RR5 pKa = 11.84IEE7 pKa = 4.07QSIKK11 pKa = 11.0DD12 pKa = 3.45WDD14 pKa = 3.98DD15 pKa = 3.21KK16 pKa = 11.87YY17 pKa = 11.35KK18 pKa = 11.28VKK20 pKa = 10.93DD21 pKa = 3.58LDD23 pKa = 3.87YY24 pKa = 11.51LNLEE28 pKa = 4.41VPQPSSFQNLSSLGFFCFHH47 pKa = 6.17QNCKK51 pKa = 10.27HH52 pKa = 5.83SLEE55 pKa = 4.6SSSSQLNLLTDD66 pKa = 4.36LALVQHH72 pKa = 6.73LNLEE76 pKa = 4.64FTHH79 pKa = 6.43SRR81 pKa = 11.84VGLSARR87 pKa = 11.84IAIKK91 pKa = 10.35YY92 pKa = 7.02FHH94 pKa = 7.15SISNQLKK101 pKa = 9.0EE102 pKa = 4.35QEE104 pKa = 4.34EE105 pKa = 4.15QLKK108 pKa = 8.08TVAATQKK115 pKa = 10.55KK116 pKa = 8.78IQKK119 pKa = 7.96QLKK122 pKa = 8.31SLEE125 pKa = 4.46GEE127 pKa = 4.43LEE129 pKa = 3.73QHH131 pKa = 6.41RR132 pKa = 11.84PLSRR136 pKa = 11.84TDD138 pKa = 3.24VQQLVQEE145 pKa = 5.02IAQQPKK151 pKa = 10.15LVEE154 pKa = 4.21AEE156 pKa = 4.2ALRR159 pKa = 11.84LTQDD163 pKa = 3.5LEE165 pKa = 4.13RR166 pKa = 11.84RR167 pKa = 11.84LNEE170 pKa = 4.04VKK172 pKa = 10.68DD173 pKa = 3.67LLGEE177 pKa = 4.17VKK179 pKa = 10.36KK180 pKa = 10.97ALLSS184 pKa = 3.7
Molecular weight: 21.2 kDa
Isoelectric point according different methods:
Protein with the highest isoelectric point:
>tr|A0A0X8R425|A0A0X8R425_9VIRU Reverse transcriptase OS=Blackberry virus F OX=2560349 PE=4 SV=1
MM1 pKa = 7.56SDD3 pKa = 2.68WRR5 pKa = 11.84VTQGSSVYY13 pKa = 10.56KK14 pKa = 10.26EE15 pKa = 3.7ATQALEE21 pKa = 5.02GLDD24 pKa = 3.66QPALGFARR32 pKa = 11.84GTDD35 pKa = 3.78FAGATNSSLQGIIKK49 pKa = 9.06QQNLQIQLLVKK60 pKa = 9.73LTEE63 pKa = 4.21KK64 pKa = 11.11VEE66 pKa = 4.63DD67 pKa = 3.72LQQEE71 pKa = 4.36IKK73 pKa = 9.3TLKK76 pKa = 9.42AAKK79 pKa = 9.72AKK81 pKa = 10.26AAAEE85 pKa = 4.1SSSEE89 pKa = 3.97DD90 pKa = 3.93LEE92 pKa = 4.32SQIIGLSKK100 pKa = 10.94KK101 pKa = 9.97LDD103 pKa = 3.63KK104 pKa = 11.22VSLGTGVVPKK114 pKa = 10.41KK115 pKa = 9.19RR116 pKa = 11.84TPYY119 pKa = 9.85YY120 pKa = 10.57VKK122 pKa = 10.24EE123 pKa = 4.31DD124 pKa = 3.45PAKK127 pKa = 9.61IFEE130 pKa = 4.41RR131 pKa = 11.84EE132 pKa = 3.83FAKK135 pKa = 10.29TKK137 pKa = 10.67
MM1 pKa = 7.56SDD3 pKa = 2.68WRR5 pKa = 11.84VTQGSSVYY13 pKa = 10.56KK14 pKa = 10.26EE15 pKa = 3.7ATQALEE21 pKa = 5.02GLDD24 pKa = 3.66QPALGFARR32 pKa = 11.84GTDD35 pKa = 3.78FAGATNSSLQGIIKK49 pKa = 9.06QQNLQIQLLVKK60 pKa = 9.73LTEE63 pKa = 4.21KK64 pKa = 11.11VEE66 pKa = 4.63DD67 pKa = 3.72LQQEE71 pKa = 4.36IKK73 pKa = 9.3TLKK76 pKa = 9.42AAKK79 pKa = 9.72AKK81 pKa = 10.26AAAEE85 pKa = 4.1SSSEE89 pKa = 3.97DD90 pKa = 3.93LEE92 pKa = 4.32SQIIGLSKK100 pKa = 10.94KK101 pKa = 9.97LDD103 pKa = 3.63KK104 pKa = 11.22VSLGTGVVPKK114 pKa = 10.41KK115 pKa = 9.19RR116 pKa = 11.84TPYY119 pKa = 9.85YY120 pKa = 10.57VKK122 pKa = 10.24EE123 pKa = 4.31DD124 pKa = 3.45PAKK127 pKa = 9.61IFEE130 pKa = 4.41RR131 pKa = 11.84EE132 pKa = 3.83FAKK135 pKa = 10.29TKK137 pKa = 10.67
Molecular weight: 15.02 kDa
Isoelectric point according different methods:
Peptides (in silico digests for buttom-up proteomics)
Below you can find in silico digests of the whole proteome with Trypsin, Chymotrypsin, Trypsin+LysC, LysN, ArgC proteases suitable for different mass spec machines.| Try ESI |
 |
|---|
| ChTry ESI |
 |
|---|
| ArgC ESI |
 |
|---|
| LysN ESI |
 |
|---|
| TryLysC ESI |
 |
|---|
| Try MALDI |
 |
|---|
| ChTry MALDI |
 |
|---|
| ArgC MALDI |
 |
|---|
| LysN MALDI |
 |
|---|
| TryLysC MALDI |
 |
|---|
| Try LTQ |
 |
|---|
| ChTry LTQ |
 |
|---|
| ArgC LTQ |
 |
|---|
| LysN LTQ |
 |
|---|
| TryLysC LTQ |
 |
|---|
| Try MSlow |
 |
|---|
| ChTry MSlow |
 |
|---|
| ArgC MSlow |
 |
|---|
| LysN MSlow |
 |
|---|
| TryLysC MSlow |
 |
|---|
| Try MShigh |
 |
|---|
| ChTry MShigh |
 |
|---|
| ArgC MShigh |
 |
|---|
| LysN MShigh |
 |
|---|
| TryLysC MShigh |
 |
|---|
General Statistics
Number of major isoforms |
Number of additional isoforms |
Number of all proteins |
Number of amino acids |
Min. Seq. Length |
Max. Seq. Length |
Avg. Seq. Length |
Avg. Mol. Weight |
|---|---|---|---|---|---|---|---|
0 |
2269 |
137 |
1948 |
756.3 |
86.39 |
Amino acid frequency
Ala |
Cys |
Asp |
Glu |
Phe |
Gly |
His |
Ile |
Lys |
Leu |
|---|---|---|---|---|---|---|---|---|---|
6.082 ± 1.033 | 1.631 ± 0.533 |
5.156 ± 0.088 | 8.991 ± 0.233 |
2.953 ± 0.092 | 5.685 ± 1.002 |
2.248 ± 0.539 | 5.553 ± 0.603 |
7.977 ± 1.301 | 7.801 ± 2.976 |
Met |
Asn |
Gln |
Pro |
Arg |
Ser |
Thr |
Val |
Trp |
Tyr |
|---|---|---|---|---|---|---|---|---|---|
2.424 ± 0.883 | 3.526 ± 0.52 |
4.848 ± 1.154 | 5.421 ± 1.933 |
5.729 ± 1.018 | 7.316 ± 0.701 |
5.862 ± 0.576 | 5.377 ± 0.133 |
1.587 ± 0.472 | 3.834 ± 0.963 |
Most of the basic statistics you can see at this page can be downloaded from this CSV file
Proteome-pI is available under Creative Commons Attribution-NoDerivs license, for more details see here
| Reference: Kozlowski LP. Proteome-pI 2.0: Proteome Isoelectric Point Database Update. Nucleic Acids Res. 2021, doi: 10.1093/nar/gkab944 | Contact: Lukasz P. Kozlowski |
