Microbacterium sorbitolivorans
Taxonomy: cellular organisms; Bacteria; Terrabacteria group; Actinobacteria; Actinomycetia; Micrococcales; Microbacteriaceae; Microbacterium
Average proteome isoelectric point is 5.92
Get precalculated fractions of proteins

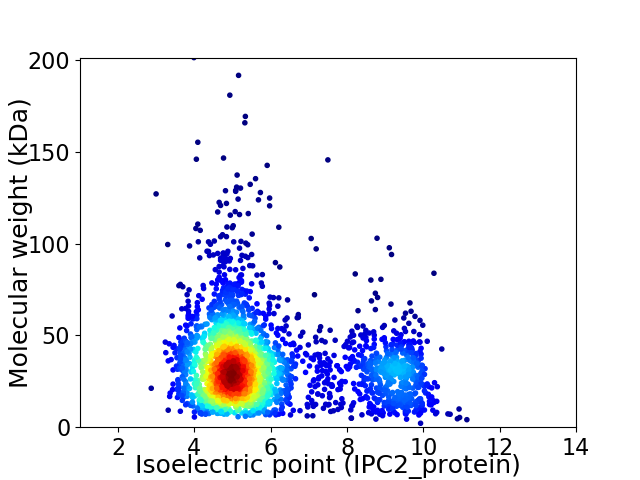
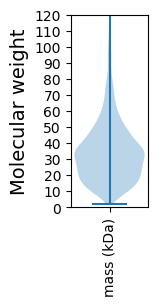
Virtual 2D-PAGE plot for 2725 proteins (isoelectric point calculated using IPC2_protein)
Get csv file with sequences according to given criteria:
* You can choose from 21 different methods for calculating isoelectric point
Summary statistics related to proteome-wise predictions


Protein with the lowest isoelectric point:
>tr|A0A367Y1N4|A0A367Y1N4_9MICO Cyclic pyranopterin monophosphate synthase OS=Microbacterium sorbitolivorans OX=1867410 GN=moaC PE=3 SV=1
MM1 pKa = 7.7PLALTHH7 pKa = 7.31RR8 pKa = 11.84ITVALVAVVCGVSLLGGCTSSVPHH32 pKa = 6.56LADD35 pKa = 3.51PTEE38 pKa = 4.26TAALTVSPSDD48 pKa = 3.46TLTPTATPEE57 pKa = 3.78QKK59 pKa = 8.63QTNDD63 pKa = 3.38AADD66 pKa = 4.5PDD68 pKa = 3.9TWLVTEE74 pKa = 4.48SAIGPIEE81 pKa = 4.1IGADD85 pKa = 3.4FDD87 pKa = 4.16STLTTIRR94 pKa = 11.84STGVGTLDD102 pKa = 4.11CEE104 pKa = 4.38GVAYY108 pKa = 10.16GFAADD113 pKa = 3.6NAYY116 pKa = 10.31DD117 pKa = 3.31ILMIGDD123 pKa = 3.92RR124 pKa = 11.84EE125 pKa = 4.12GDD127 pKa = 3.19SGAISEE133 pKa = 5.25VSIGWNSDD141 pKa = 2.94TMGVGPRR148 pKa = 11.84TAEE151 pKa = 3.83ALGLGSTKK159 pKa = 10.76DD160 pKa = 3.42QVLAAYY166 pKa = 8.87EE167 pKa = 4.07DD168 pKa = 4.1AVEE171 pKa = 4.34EE172 pKa = 4.24DD173 pKa = 3.93SQIVGHH179 pKa = 6.15TYY181 pKa = 8.94VTIPDD186 pKa = 3.55KK187 pKa = 11.48DD188 pKa = 3.94GVSKK192 pKa = 10.91LVFGYY197 pKa = 10.52RR198 pKa = 11.84DD199 pKa = 3.89GYY201 pKa = 11.1DD202 pKa = 3.24GAVSVSVITGEE213 pKa = 3.99EE214 pKa = 3.78PAYY217 pKa = 9.85EE218 pKa = 4.23PCAA221 pKa = 3.79
MM1 pKa = 7.7PLALTHH7 pKa = 7.31RR8 pKa = 11.84ITVALVAVVCGVSLLGGCTSSVPHH32 pKa = 6.56LADD35 pKa = 3.51PTEE38 pKa = 4.26TAALTVSPSDD48 pKa = 3.46TLTPTATPEE57 pKa = 3.78QKK59 pKa = 8.63QTNDD63 pKa = 3.38AADD66 pKa = 4.5PDD68 pKa = 3.9TWLVTEE74 pKa = 4.48SAIGPIEE81 pKa = 4.1IGADD85 pKa = 3.4FDD87 pKa = 4.16STLTTIRR94 pKa = 11.84STGVGTLDD102 pKa = 4.11CEE104 pKa = 4.38GVAYY108 pKa = 10.16GFAADD113 pKa = 3.6NAYY116 pKa = 10.31DD117 pKa = 3.31ILMIGDD123 pKa = 3.92RR124 pKa = 11.84EE125 pKa = 4.12GDD127 pKa = 3.19SGAISEE133 pKa = 5.25VSIGWNSDD141 pKa = 2.94TMGVGPRR148 pKa = 11.84TAEE151 pKa = 3.83ALGLGSTKK159 pKa = 10.76DD160 pKa = 3.42QVLAAYY166 pKa = 8.87EE167 pKa = 4.07DD168 pKa = 4.1AVEE171 pKa = 4.34EE172 pKa = 4.24DD173 pKa = 3.93SQIVGHH179 pKa = 6.15TYY181 pKa = 8.94VTIPDD186 pKa = 3.55KK187 pKa = 11.48DD188 pKa = 3.94GVSKK192 pKa = 10.91LVFGYY197 pKa = 10.52RR198 pKa = 11.84DD199 pKa = 3.89GYY201 pKa = 11.1DD202 pKa = 3.24GAVSVSVITGEE213 pKa = 3.99EE214 pKa = 3.78PAYY217 pKa = 9.85EE218 pKa = 4.23PCAA221 pKa = 3.79
Molecular weight: 22.79 kDa
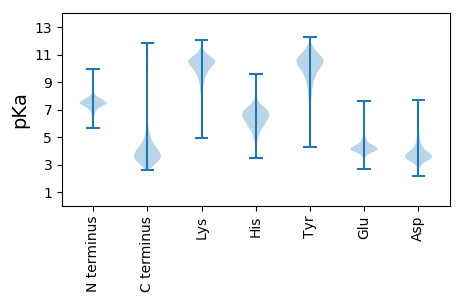
Isoelectric point according different methods:
Protein with the highest isoelectric point:
>tr|A0A367XZP8|A0A367XZP8_9MICO Phosphoglycerate dehydrogenase OS=Microbacterium sorbitolivorans OX=1867410 GN=DTO57_11210 PE=4 SV=1
MM1 pKa = 7.4GSVIKK6 pKa = 10.38KK7 pKa = 8.42RR8 pKa = 11.84RR9 pKa = 11.84KK10 pKa = 9.06RR11 pKa = 11.84MSKK14 pKa = 9.76KK15 pKa = 9.54KK16 pKa = 9.79HH17 pKa = 5.67RR18 pKa = 11.84KK19 pKa = 8.31LLRR22 pKa = 11.84KK23 pKa = 7.78TRR25 pKa = 11.84HH26 pKa = 3.65QRR28 pKa = 11.84RR29 pKa = 11.84NKK31 pKa = 9.78KK32 pKa = 9.85
MM1 pKa = 7.4GSVIKK6 pKa = 10.38KK7 pKa = 8.42RR8 pKa = 11.84RR9 pKa = 11.84KK10 pKa = 9.06RR11 pKa = 11.84MSKK14 pKa = 9.76KK15 pKa = 9.54KK16 pKa = 9.79HH17 pKa = 5.67RR18 pKa = 11.84KK19 pKa = 8.31LLRR22 pKa = 11.84KK23 pKa = 7.78TRR25 pKa = 11.84HH26 pKa = 3.65QRR28 pKa = 11.84RR29 pKa = 11.84NKK31 pKa = 9.78KK32 pKa = 9.85
Molecular weight: 4.1 kDa
Isoelectric point according different methods:
Peptides (in silico digests for buttom-up proteomics)
Below you can find in silico digests of the whole proteome with Trypsin, Chymotrypsin, Trypsin+LysC, LysN, ArgC proteases suitable for different mass spec machines.| Try ESI |
 |
|---|
| ChTry ESI |
 |
|---|
| ArgC ESI |
 |
|---|
| LysN ESI |
 |
|---|
| TryLysC ESI |
 |
|---|
| Try MALDI |
 |
|---|
| ChTry MALDI |
 |
|---|
| ArgC MALDI |
 |
|---|
| LysN MALDI |
 |
|---|
| TryLysC MALDI |
 |
|---|
| Try LTQ |
 |
|---|
| ChTry LTQ |
 |
|---|
| ArgC LTQ |
 |
|---|
| LysN LTQ |
 |
|---|
| TryLysC LTQ |
 |
|---|
| Try MSlow |
 |
|---|
| ChTry MSlow |
 |
|---|
| ArgC MSlow |
 |
|---|
| LysN MSlow |
 |
|---|
| TryLysC MSlow |
 |
|---|
| Try MShigh |
 |
|---|
| ChTry MShigh |
 |
|---|
| ArgC MShigh |
 |
|---|
| LysN MShigh |
 |
|---|
| TryLysC MShigh |
 |
|---|
General Statistics
Number of major isoforms |
Number of additional isoforms |
Number of all proteins |
Number of amino acids |
Min. Seq. Length |
Max. Seq. Length |
Avg. Seq. Length |
Avg. Mol. Weight |
|---|---|---|---|---|---|---|---|
0 |
909936 |
21 |
1908 |
333.9 |
35.85 |
Amino acid frequency
Ala |
Cys |
Asp |
Glu |
Phe |
Gly |
His |
Ile |
Lys |
Leu |
|---|---|---|---|---|---|---|---|---|---|
13.203 ± 0.075 | 0.478 ± 0.01 |
6.39 ± 0.046 | 6.13 ± 0.043 |
3.241 ± 0.026 | 8.894 ± 0.041 |
1.94 ± 0.021 | 5.018 ± 0.036 |
2.226 ± 0.035 | 9.706 ± 0.049 |
Met |
Asn |
Gln |
Pro |
Arg |
Ser |
Thr |
Val |
Trp |
Tyr |
|---|---|---|---|---|---|---|---|---|---|
1.923 ± 0.02 | 2.156 ± 0.025 |
5.081 ± 0.036 | 2.78 ± 0.024 |
7.024 ± 0.056 | 5.773 ± 0.032 |
5.958 ± 0.033 | 8.469 ± 0.043 |
1.539 ± 0.02 | 2.071 ± 0.023 |
Most of the basic statistics you can see at this page can be downloaded from this CSV file
Proteome-pI is available under Creative Commons Attribution-NoDerivs license, for more details see here
| Reference: Kozlowski LP. Proteome-pI 2.0: Proteome Isoelectric Point Database Update. Nucleic Acids Res. 2021, doi: 10.1093/nar/gkab944 | Contact: Lukasz P. Kozlowski |
