Streptomyces sp. NA04227
Taxonomy: cellular organisms; Bacteria; Terrabacteria group; Actinobacteria; Actinomycetia; Streptomycetales; Streptomycetaceae; Streptomyces; unclassified Streptomyces
Average proteome isoelectric point is 6.24
Get precalculated fractions of proteins

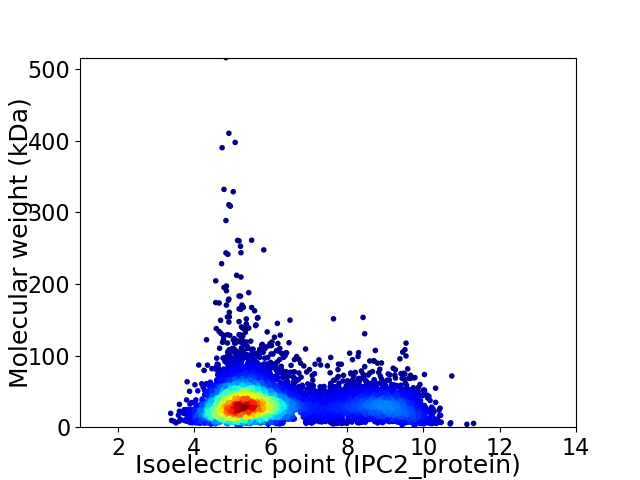
Virtual 2D-PAGE plot for 6361 proteins (isoelectric point calculated using IPC2_protein)
Get csv file with sequences according to given criteria:
* You can choose from 21 different methods for calculating isoelectric point
Summary statistics related to proteome-wise predictions


Protein with the lowest isoelectric point:
>tr|A0A7H8JWY2|A0A7H8JWY2_9ACTN GYD domain-containing protein OS=Streptomyces sp. NA04227 OX=2742136 GN=HUT18_24440 PE=4 SV=1
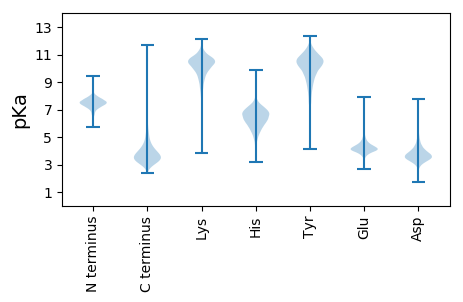
MM1 pKa = 7.21SRR3 pKa = 11.84SARR6 pKa = 11.84TSRR9 pKa = 11.84SLGLLAASALIALPVGVGLAALPASAAEE37 pKa = 4.13PTATAVADD45 pKa = 4.28DD46 pKa = 4.81GGHH49 pKa = 5.63SVTYY53 pKa = 9.03TAGAQQYY60 pKa = 8.91NEE62 pKa = 4.1VVITEE67 pKa = 4.13AKK69 pKa = 8.82GTEE72 pKa = 3.93FTIDD76 pKa = 3.31DD77 pKa = 4.52TVPITAGTGCVHH89 pKa = 7.44PDD91 pKa = 2.79KK92 pKa = 10.85TDD94 pKa = 3.25QTKK97 pKa = 9.44VVCTLTEE104 pKa = 4.4FGDD107 pKa = 3.67YY108 pKa = 8.62WVRR111 pKa = 11.84IHH113 pKa = 7.56VDD115 pKa = 2.74LGDD118 pKa = 4.08YY119 pKa = 10.56KK120 pKa = 11.41DD121 pKa = 4.25EE122 pKa = 5.08LSMHH126 pKa = 7.09AGNEE130 pKa = 4.07NVIHH134 pKa = 6.45GGSGNDD140 pKa = 3.39TLTGDD145 pKa = 4.44GNDD148 pKa = 3.72MLYY151 pKa = 11.04GDD153 pKa = 5.64DD154 pKa = 5.69GDD156 pKa = 4.23DD157 pKa = 3.59TLTGGTQLGGNGADD171 pKa = 4.24LLSAPNYY178 pKa = 10.1SADD181 pKa = 3.33GGYY184 pKa = 11.31GNDD187 pKa = 3.71TLVGTDD193 pKa = 5.01DD194 pKa = 5.49ADD196 pKa = 3.77TLYY199 pKa = 11.04GGPDD203 pKa = 3.25HH204 pKa = 7.73DD205 pKa = 4.43MLIGRR210 pKa = 11.84AGDD213 pKa = 3.46DD214 pKa = 3.3VLYY217 pKa = 10.97GNSGNDD223 pKa = 3.44TIYY226 pKa = 11.17GGGGNDD232 pKa = 4.24TISGGPGTNEE242 pKa = 3.08IHH244 pKa = 5.78QQ245 pKa = 3.98
MM1 pKa = 7.21SRR3 pKa = 11.84SARR6 pKa = 11.84TSRR9 pKa = 11.84SLGLLAASALIALPVGVGLAALPASAAEE37 pKa = 4.13PTATAVADD45 pKa = 4.28DD46 pKa = 4.81GGHH49 pKa = 5.63SVTYY53 pKa = 9.03TAGAQQYY60 pKa = 8.91NEE62 pKa = 4.1VVITEE67 pKa = 4.13AKK69 pKa = 8.82GTEE72 pKa = 3.93FTIDD76 pKa = 3.31DD77 pKa = 4.52TVPITAGTGCVHH89 pKa = 7.44PDD91 pKa = 2.79KK92 pKa = 10.85TDD94 pKa = 3.25QTKK97 pKa = 9.44VVCTLTEE104 pKa = 4.4FGDD107 pKa = 3.67YY108 pKa = 8.62WVRR111 pKa = 11.84IHH113 pKa = 7.56VDD115 pKa = 2.74LGDD118 pKa = 4.08YY119 pKa = 10.56KK120 pKa = 11.41DD121 pKa = 4.25EE122 pKa = 5.08LSMHH126 pKa = 7.09AGNEE130 pKa = 4.07NVIHH134 pKa = 6.45GGSGNDD140 pKa = 3.39TLTGDD145 pKa = 4.44GNDD148 pKa = 3.72MLYY151 pKa = 11.04GDD153 pKa = 5.64DD154 pKa = 5.69GDD156 pKa = 4.23DD157 pKa = 3.59TLTGGTQLGGNGADD171 pKa = 4.24LLSAPNYY178 pKa = 10.1SADD181 pKa = 3.33GGYY184 pKa = 11.31GNDD187 pKa = 3.71TLVGTDD193 pKa = 5.01DD194 pKa = 5.49ADD196 pKa = 3.77TLYY199 pKa = 11.04GGPDD203 pKa = 3.25HH204 pKa = 7.73DD205 pKa = 4.43MLIGRR210 pKa = 11.84AGDD213 pKa = 3.46DD214 pKa = 3.3VLYY217 pKa = 10.97GNSGNDD223 pKa = 3.44TIYY226 pKa = 11.17GGGGNDD232 pKa = 4.24TISGGPGTNEE242 pKa = 3.08IHH244 pKa = 5.78QQ245 pKa = 3.98
Molecular weight: 24.89 kDa
Isoelectric point according different methods:
Protein with the highest isoelectric point:
>tr|A0A7H8JVY9|A0A7H8JVY9_9ACTN Type II secretion system F family protein OS=Streptomyces sp. NA04227 OX=2742136 GN=HUT18_20980 PE=4 SV=1
MM1 pKa = 7.69SKK3 pKa = 9.0RR4 pKa = 11.84TFQPNNRR11 pKa = 11.84RR12 pKa = 11.84RR13 pKa = 11.84AKK15 pKa = 8.7THH17 pKa = 5.15GFRR20 pKa = 11.84LRR22 pKa = 11.84MRR24 pKa = 11.84TRR26 pKa = 11.84AGRR29 pKa = 11.84AILASRR35 pKa = 11.84RR36 pKa = 11.84GKK38 pKa = 10.36GRR40 pKa = 11.84ARR42 pKa = 11.84LSAA45 pKa = 3.91
MM1 pKa = 7.69SKK3 pKa = 9.0RR4 pKa = 11.84TFQPNNRR11 pKa = 11.84RR12 pKa = 11.84RR13 pKa = 11.84AKK15 pKa = 8.7THH17 pKa = 5.15GFRR20 pKa = 11.84LRR22 pKa = 11.84MRR24 pKa = 11.84TRR26 pKa = 11.84AGRR29 pKa = 11.84AILASRR35 pKa = 11.84RR36 pKa = 11.84GKK38 pKa = 10.36GRR40 pKa = 11.84ARR42 pKa = 11.84LSAA45 pKa = 3.91
Molecular weight: 5.25 kDa
Isoelectric point according different methods:
Peptides (in silico digests for buttom-up proteomics)
Below you can find in silico digests of the whole proteome with Trypsin, Chymotrypsin, Trypsin+LysC, LysN, ArgC proteases suitable for different mass spec machines.| Try ESI |
 |
|---|
| ChTry ESI |
 |
|---|
| ArgC ESI |
 |
|---|
| LysN ESI |
 |
|---|
| TryLysC ESI |
 |
|---|
| Try MALDI |
 |
|---|
| ChTry MALDI |
 |
|---|
| ArgC MALDI |
 |
|---|
| LysN MALDI |
 |
|---|
| TryLysC MALDI |
 |
|---|
| Try LTQ |
 |
|---|
| ChTry LTQ |
 |
|---|
| ArgC LTQ |
 |
|---|
| LysN LTQ |
 |
|---|
| TryLysC LTQ |
 |
|---|
| Try MSlow |
 |
|---|
| ChTry MSlow |
 |
|---|
| ArgC MSlow |
 |
|---|
| LysN MSlow |
 |
|---|
| TryLysC MSlow |
 |
|---|
| Try MShigh |
 |
|---|
| ChTry MShigh |
 |
|---|
| ArgC MShigh |
 |
|---|
| LysN MShigh |
 |
|---|
| TryLysC MShigh |
 |
|---|
General Statistics
Number of major isoforms |
Number of additional isoforms |
Number of all proteins |
Number of amino acids |
Min. Seq. Length |
Max. Seq. Length |
Avg. Seq. Length |
Avg. Mol. Weight |
|---|---|---|---|---|---|---|---|
0 |
2163193 |
19 |
4938 |
340.1 |
36.45 |
Amino acid frequency
Ala |
Cys |
Asp |
Glu |
Phe |
Gly |
His |
Ile |
Lys |
Leu |
|---|---|---|---|---|---|---|---|---|---|
13.35 ± 0.042 | 0.809 ± 0.008 |
5.966 ± 0.026 | 6.182 ± 0.03 |
2.705 ± 0.016 | 9.575 ± 0.034 |
2.329 ± 0.014 | 2.983 ± 0.019 |
2.303 ± 0.029 | 10.306 ± 0.04 |
Met |
Asn |
Gln |
Pro |
Arg |
Ser |
Thr |
Val |
Trp |
Tyr |
|---|---|---|---|---|---|---|---|---|---|
1.67 ± 0.012 | 1.799 ± 0.018 |
6.139 ± 0.03 | 2.842 ± 0.018 |
8.095 ± 0.035 | 5.265 ± 0.023 |
6.001 ± 0.022 | 8.142 ± 0.034 |
1.486 ± 0.013 | 2.054 ± 0.017 |
Most of the basic statistics you can see at this page can be downloaded from this CSV file
Proteome-pI is available under Creative Commons Attribution-NoDerivs license, for more details see here
| Reference: Kozlowski LP. Proteome-pI 2.0: Proteome Isoelectric Point Database Update. Nucleic Acids Res. 2021, doi: 10.1093/nar/gkab944 | Contact: Lukasz P. Kozlowski |
