East African cassava mosaic virus
Taxonomy: Viruses; Monodnaviria; Shotokuvirae; Cressdnaviricota; Repensiviricetes; Geplafuvirales; Geminiviridae; Begomovirus
Average proteome isoelectric point is 7.76
Get precalculated fractions of proteins

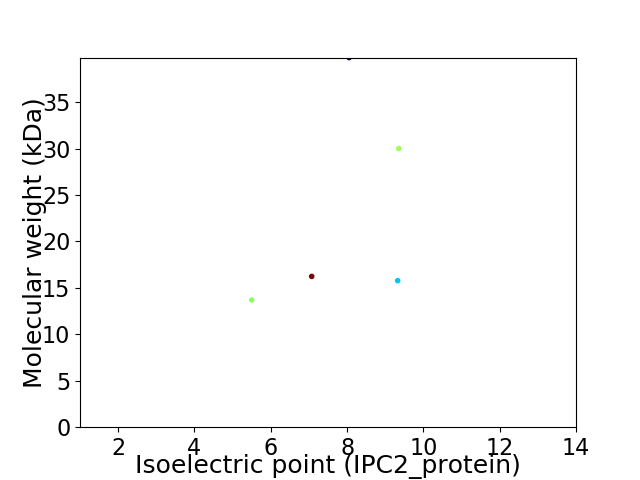
Virtual 2D-PAGE plot for 5 proteins (isoelectric point calculated using IPC2_protein)
Get csv file with sequences according to given criteria:
* You can choose from 21 different methods for calculating isoelectric point
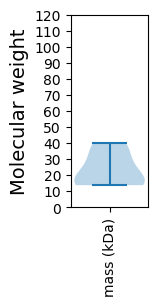
Summary statistics related to proteome-wise predictions


Protein with the lowest isoelectric point:
>tr|U3LY20|U3LY20_9GEMI Replication-associated protein OS=East African cassava mosaic virus OX=62079 GN=AC1 PE=3 SV=1
MM1 pKa = 8.09WDD3 pKa = 3.51PLLNDD8 pKa = 3.72FPEE11 pKa = 4.7TVHH14 pKa = 6.61GFRR17 pKa = 11.84SMLAVKK23 pKa = 10.21YY24 pKa = 10.06LLHH27 pKa = 7.24LEE29 pKa = 4.05QEE31 pKa = 4.43YY32 pKa = 11.26DD33 pKa = 3.21RR34 pKa = 11.84GTVGAEE40 pKa = 4.21YY41 pKa = 9.66IWDD44 pKa = 4.8LIGVLRR50 pKa = 11.84CEE52 pKa = 4.68SYY54 pKa = 10.9VEE56 pKa = 3.65ATRR59 pKa = 11.84RR60 pKa = 11.84YY61 pKa = 9.31NNLNTRR67 pKa = 11.84IQGAEE72 pKa = 3.96EE73 pKa = 4.16AEE75 pKa = 4.04LRR77 pKa = 11.84QPIQEE82 pKa = 4.26PCCCPHH88 pKa = 7.07CPRR91 pKa = 11.84HH92 pKa = 5.47QKK94 pKa = 10.61QNMGQQAHH102 pKa = 5.32VSEE105 pKa = 4.72AQDD108 pKa = 3.39VQNVSKK114 pKa = 10.24PRR116 pKa = 11.84CPP118 pKa = 3.47
MM1 pKa = 8.09WDD3 pKa = 3.51PLLNDD8 pKa = 3.72FPEE11 pKa = 4.7TVHH14 pKa = 6.61GFRR17 pKa = 11.84SMLAVKK23 pKa = 10.21YY24 pKa = 10.06LLHH27 pKa = 7.24LEE29 pKa = 4.05QEE31 pKa = 4.43YY32 pKa = 11.26DD33 pKa = 3.21RR34 pKa = 11.84GTVGAEE40 pKa = 4.21YY41 pKa = 9.66IWDD44 pKa = 4.8LIGVLRR50 pKa = 11.84CEE52 pKa = 4.68SYY54 pKa = 10.9VEE56 pKa = 3.65ATRR59 pKa = 11.84RR60 pKa = 11.84YY61 pKa = 9.31NNLNTRR67 pKa = 11.84IQGAEE72 pKa = 3.96EE73 pKa = 4.16AEE75 pKa = 4.04LRR77 pKa = 11.84QPIQEE82 pKa = 4.26PCCCPHH88 pKa = 7.07CPRR91 pKa = 11.84HH92 pKa = 5.47QKK94 pKa = 10.61QNMGQQAHH102 pKa = 5.32VSEE105 pKa = 4.72AQDD108 pKa = 3.39VQNVSKK114 pKa = 10.24PRR116 pKa = 11.84CPP118 pKa = 3.47
Molecular weight: 13.7 kDa
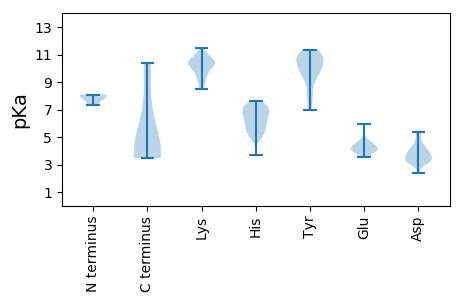
Isoelectric point according different methods:
Protein with the highest isoelectric point:
>tr|U3LZP4|U3LZP4_9GEMI Replication enhancer OS=East African cassava mosaic virus OX=62079 GN=AC3 PE=3 SV=1
MM1 pKa = 7.98RR2 pKa = 11.84YY3 pKa = 9.59SSPSQSHH10 pKa = 6.46SSPPPIKK17 pKa = 10.22ARR19 pKa = 11.84HH20 pKa = 5.05RR21 pKa = 11.84QAKK24 pKa = 8.58IRR26 pKa = 11.84APRR29 pKa = 11.84RR30 pKa = 11.84RR31 pKa = 11.84RR32 pKa = 11.84IDD34 pKa = 3.62LSCGCSIYY42 pKa = 10.64RR43 pKa = 11.84SINCHH48 pKa = 3.71NHH50 pKa = 5.17GFTHH54 pKa = 7.48RR55 pKa = 11.84GTHH58 pKa = 5.82HH59 pKa = 6.87CSSSAEE65 pKa = 3.53WRR67 pKa = 11.84IYY69 pKa = 10.29MGDD72 pKa = 3.26TKK74 pKa = 11.22SPIFQNPQPQQQAVQHH90 pKa = 5.86EE91 pKa = 4.68PRR93 pKa = 11.84HH94 pKa = 5.39HH95 pKa = 6.78RR96 pKa = 11.84CPDD99 pKa = 3.32SVQLQLNKK107 pKa = 10.3EE108 pKa = 4.39HH109 pKa = 7.14ILFHH113 pKa = 7.34DD114 pKa = 4.24FLIQTGYY121 pKa = 8.55PQKK124 pKa = 10.61LYY126 pKa = 10.58SIHH129 pKa = 7.64DD130 pKa = 4.13ALHH133 pKa = 6.28LLL135 pKa = 4.05
MM1 pKa = 7.98RR2 pKa = 11.84YY3 pKa = 9.59SSPSQSHH10 pKa = 6.46SSPPPIKK17 pKa = 10.22ARR19 pKa = 11.84HH20 pKa = 5.05RR21 pKa = 11.84QAKK24 pKa = 8.58IRR26 pKa = 11.84APRR29 pKa = 11.84RR30 pKa = 11.84RR31 pKa = 11.84RR32 pKa = 11.84IDD34 pKa = 3.62LSCGCSIYY42 pKa = 10.64RR43 pKa = 11.84SINCHH48 pKa = 3.71NHH50 pKa = 5.17GFTHH54 pKa = 7.48RR55 pKa = 11.84GTHH58 pKa = 5.82HH59 pKa = 6.87CSSSAEE65 pKa = 3.53WRR67 pKa = 11.84IYY69 pKa = 10.29MGDD72 pKa = 3.26TKK74 pKa = 11.22SPIFQNPQPQQQAVQHH90 pKa = 5.86EE91 pKa = 4.68PRR93 pKa = 11.84HH94 pKa = 5.39HH95 pKa = 6.78RR96 pKa = 11.84CPDD99 pKa = 3.32SVQLQLNKK107 pKa = 10.3EE108 pKa = 4.39HH109 pKa = 7.14ILFHH113 pKa = 7.34DD114 pKa = 4.24FLIQTGYY121 pKa = 8.55PQKK124 pKa = 10.61LYY126 pKa = 10.58SIHH129 pKa = 7.64DD130 pKa = 4.13ALHH133 pKa = 6.28LLL135 pKa = 4.05
Molecular weight: 15.77 kDa
Isoelectric point according different methods:
Peptides (in silico digests for buttom-up proteomics)
Below you can find in silico digests of the whole proteome with Trypsin, Chymotrypsin, Trypsin+LysC, LysN, ArgC proteases suitable for different mass spec machines.| Try ESI |
 |
|---|
| ChTry ESI |
 |
|---|
| ArgC ESI |
 |
|---|
| LysN ESI |
 |
|---|
| TryLysC ESI |
 |
|---|
| Try MALDI |
 |
|---|
| ChTry MALDI |
 |
|---|
| ArgC MALDI |
 |
|---|
| LysN MALDI |
 |
|---|
| TryLysC MALDI |
 |
|---|
| Try LTQ |
 |
|---|
| ChTry LTQ |
 |
|---|
| ArgC LTQ |
 |
|---|
| LysN LTQ |
 |
|---|
| TryLysC LTQ |
 |
|---|
| Try MSlow |
 |
|---|
| ChTry MSlow |
 |
|---|
| ArgC MSlow |
 |
|---|
| LysN MSlow |
 |
|---|
| TryLysC MSlow |
 |
|---|
| Try MShigh |
 |
|---|
| ChTry MShigh |
 |
|---|
| ArgC MShigh |
 |
|---|
| LysN MShigh |
 |
|---|
| TryLysC MShigh |
 |
|---|
General Statistics
Number of major isoforms |
Number of additional isoforms |
Number of all proteins |
Number of amino acids |
Min. Seq. Length |
Max. Seq. Length |
Avg. Seq. Length |
Avg. Mol. Weight |
|---|---|---|---|---|---|---|---|
0 |
996 |
118 |
352 |
199.2 |
23.1 |
Amino acid frequency
Ala |
Cys |
Asp |
Glu |
Phe |
Gly |
His |
Ile |
Lys |
Leu |
|---|---|---|---|---|---|---|---|---|---|
5.12 ± 0.88 | 2.51 ± 0.571 |
4.719 ± 0.257 | 4.719 ± 0.903 |
4.618 ± 0.742 | 4.618 ± 0.513 |
4.116 ± 1.265 | 6.627 ± 0.953 |
5.422 ± 0.814 | 6.124 ± 0.761 |
Met |
Asn |
Gln |
Pro |
Arg |
Ser |
Thr |
Val |
Trp |
Tyr |
|---|---|---|---|---|---|---|---|---|---|
2.41 ± 0.595 | 5.723 ± 0.75 |
6.827 ± 0.258 | 5.422 ± 0.971 |
7.329 ± 1.047 | 8.133 ± 1.719 |
4.418 ± 0.501 | 4.819 ± 1.266 |
1.305 ± 0.305 | 5.02 ± 0.467 |
Most of the basic statistics you can see at this page can be downloaded from this CSV file
Proteome-pI is available under Creative Commons Attribution-NoDerivs license, for more details see here
| Reference: Kozlowski LP. Proteome-pI 2.0: Proteome Isoelectric Point Database Update. Nucleic Acids Res. 2021, doi: 10.1093/nar/gkab944 | Contact: Lukasz P. Kozlowski |
