Leucobacter sp. 7(1)
Taxonomy: cellular organisms; Bacteria; Terrabacteria group; Actinobacteria; Actinomycetia; Micrococcales; Microbacteriaceae; Leucobacter; unclassified Leucobacter
Average proteome isoelectric point is 6.08
Get precalculated fractions of proteins

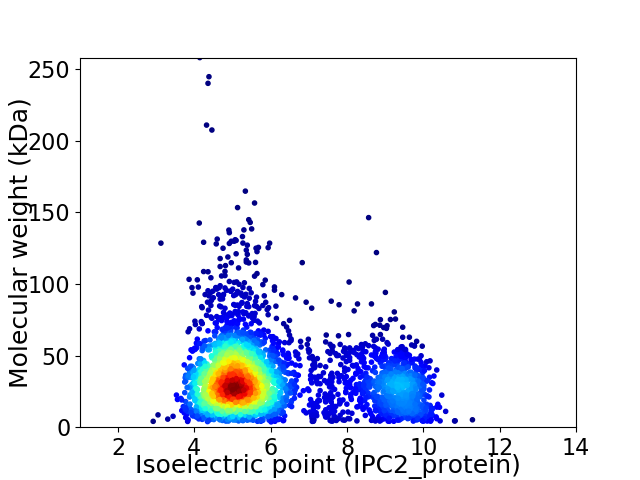
Virtual 2D-PAGE plot for 3533 proteins (isoelectric point calculated using IPC2_protein)
Get csv file with sequences according to given criteria:
* You can choose from 21 different methods for calculating isoelectric point
Summary statistics related to proteome-wise predictions


Protein with the lowest isoelectric point:
>tr|A0A1R4HKK8|A0A1R4HKK8_9MICO Putative conserved integral membrane protein OS=Leucobacter sp. 7(1) OX=1255613 GN=FM113_00670 PE=4 SV=1
MM1 pKa = 7.07RR2 pKa = 11.84TSVLAVGALATLALGLVGCSAGTPGDD28 pKa = 3.7APAEE32 pKa = 4.12EE33 pKa = 4.55SSAWPEE39 pKa = 4.33SITLSLVPSVEE50 pKa = 4.15GEE52 pKa = 4.29DD53 pKa = 3.58LAEE56 pKa = 4.59ALDD59 pKa = 4.17PLTTYY64 pKa = 10.86LSEE67 pKa = 3.93QLGIEE72 pKa = 4.26VEE74 pKa = 4.4GVVANDD80 pKa = 3.24YY81 pKa = 10.89AATVEE86 pKa = 5.11ALGADD91 pKa = 3.58QAQVIISDD99 pKa = 3.69AGSLYY104 pKa = 10.49QAMEE108 pKa = 3.93QYY110 pKa = 10.59DD111 pKa = 4.16AEE113 pKa = 4.41LVLRR117 pKa = 11.84DD118 pKa = 3.56VRR120 pKa = 11.84FGATSYY126 pKa = 11.31AAVGYY131 pKa = 8.0TNNPDD136 pKa = 3.75KK137 pKa = 11.32YY138 pKa = 10.64CADD141 pKa = 3.82TPVMAKK147 pKa = 10.08YY148 pKa = 9.8AASDD152 pKa = 3.66IEE154 pKa = 4.6LSYY157 pKa = 11.75CNGTEE162 pKa = 3.93QAGVDD167 pKa = 3.58ASGAGPAGLEE177 pKa = 4.03SLKK180 pKa = 11.05KK181 pKa = 9.6IDD183 pKa = 4.44AGTKK187 pKa = 9.52VALQAATSPAGYY199 pKa = 9.58QYY201 pKa = 10.52PIVAMRR207 pKa = 11.84DD208 pKa = 3.05ARR210 pKa = 11.84INTDD214 pKa = 2.99TGITQVPVEE223 pKa = 4.28GNNNAVLAVANGDD236 pKa = 3.74AEE238 pKa = 4.5VSFGYY243 pKa = 9.78WDD245 pKa = 3.55ARR247 pKa = 11.84TTVTAEE253 pKa = 4.03APDD256 pKa = 3.43IAEE259 pKa = 4.18KK260 pKa = 10.8VVAFAYY266 pKa = 9.84TEE268 pKa = 4.19MIPNGGVAVAPTLPADD284 pKa = 4.32LVAEE288 pKa = 4.41LTEE291 pKa = 4.51LMAGYY296 pKa = 10.62ADD298 pKa = 3.56SSEE301 pKa = 4.13EE302 pKa = 3.92AKK304 pKa = 10.06TVMFDD309 pKa = 4.33LVGLSGWTDD318 pKa = 2.97KK319 pKa = 10.56TASEE323 pKa = 4.26EE324 pKa = 3.69IARR327 pKa = 11.84YY328 pKa = 10.23GEE330 pKa = 3.99ILSEE334 pKa = 4.05FAKK337 pKa = 10.88
MM1 pKa = 7.07RR2 pKa = 11.84TSVLAVGALATLALGLVGCSAGTPGDD28 pKa = 3.7APAEE32 pKa = 4.12EE33 pKa = 4.55SSAWPEE39 pKa = 4.33SITLSLVPSVEE50 pKa = 4.15GEE52 pKa = 4.29DD53 pKa = 3.58LAEE56 pKa = 4.59ALDD59 pKa = 4.17PLTTYY64 pKa = 10.86LSEE67 pKa = 3.93QLGIEE72 pKa = 4.26VEE74 pKa = 4.4GVVANDD80 pKa = 3.24YY81 pKa = 10.89AATVEE86 pKa = 5.11ALGADD91 pKa = 3.58QAQVIISDD99 pKa = 3.69AGSLYY104 pKa = 10.49QAMEE108 pKa = 3.93QYY110 pKa = 10.59DD111 pKa = 4.16AEE113 pKa = 4.41LVLRR117 pKa = 11.84DD118 pKa = 3.56VRR120 pKa = 11.84FGATSYY126 pKa = 11.31AAVGYY131 pKa = 8.0TNNPDD136 pKa = 3.75KK137 pKa = 11.32YY138 pKa = 10.64CADD141 pKa = 3.82TPVMAKK147 pKa = 10.08YY148 pKa = 9.8AASDD152 pKa = 3.66IEE154 pKa = 4.6LSYY157 pKa = 11.75CNGTEE162 pKa = 3.93QAGVDD167 pKa = 3.58ASGAGPAGLEE177 pKa = 4.03SLKK180 pKa = 11.05KK181 pKa = 9.6IDD183 pKa = 4.44AGTKK187 pKa = 9.52VALQAATSPAGYY199 pKa = 9.58QYY201 pKa = 10.52PIVAMRR207 pKa = 11.84DD208 pKa = 3.05ARR210 pKa = 11.84INTDD214 pKa = 2.99TGITQVPVEE223 pKa = 4.28GNNNAVLAVANGDD236 pKa = 3.74AEE238 pKa = 4.5VSFGYY243 pKa = 9.78WDD245 pKa = 3.55ARR247 pKa = 11.84TTVTAEE253 pKa = 4.03APDD256 pKa = 3.43IAEE259 pKa = 4.18KK260 pKa = 10.8VVAFAYY266 pKa = 9.84TEE268 pKa = 4.19MIPNGGVAVAPTLPADD284 pKa = 4.32LVAEE288 pKa = 4.41LTEE291 pKa = 4.51LMAGYY296 pKa = 10.62ADD298 pKa = 3.56SSEE301 pKa = 4.13EE302 pKa = 3.92AKK304 pKa = 10.06TVMFDD309 pKa = 4.33LVGLSGWTDD318 pKa = 2.97KK319 pKa = 10.56TASEE323 pKa = 4.26EE324 pKa = 3.69IARR327 pKa = 11.84YY328 pKa = 10.23GEE330 pKa = 3.99ILSEE334 pKa = 4.05FAKK337 pKa = 10.88
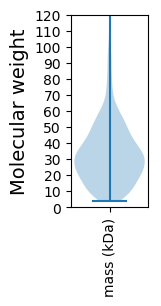
Molecular weight: 34.9 kDa
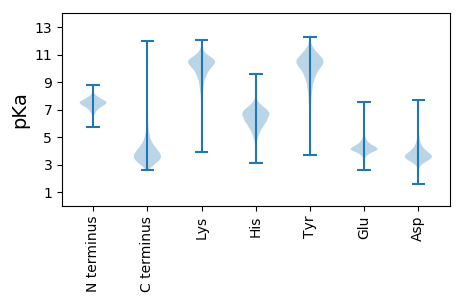
Isoelectric point according different methods:
Protein with the highest isoelectric point:
>tr|A0A1R4HVY9|A0A1R4HVY9_9MICO Urocanate hydratase OS=Leucobacter sp. 7(1) OX=1255613 GN=hutU PE=3 SV=1
MM1 pKa = 7.69SKK3 pKa = 9.0RR4 pKa = 11.84TFQPNNRR11 pKa = 11.84RR12 pKa = 11.84RR13 pKa = 11.84AKK15 pKa = 9.5VHH17 pKa = 5.46GFRR20 pKa = 11.84ARR22 pKa = 11.84MRR24 pKa = 11.84TRR26 pKa = 11.84AGRR29 pKa = 11.84AIVAARR35 pKa = 11.84RR36 pKa = 11.84GKK38 pKa = 10.45GRR40 pKa = 11.84SKK42 pKa = 10.13LTAA45 pKa = 4.04
MM1 pKa = 7.69SKK3 pKa = 9.0RR4 pKa = 11.84TFQPNNRR11 pKa = 11.84RR12 pKa = 11.84RR13 pKa = 11.84AKK15 pKa = 9.5VHH17 pKa = 5.46GFRR20 pKa = 11.84ARR22 pKa = 11.84MRR24 pKa = 11.84TRR26 pKa = 11.84AGRR29 pKa = 11.84AIVAARR35 pKa = 11.84RR36 pKa = 11.84GKK38 pKa = 10.45GRR40 pKa = 11.84SKK42 pKa = 10.13LTAA45 pKa = 4.04
Molecular weight: 5.18 kDa
Isoelectric point according different methods:
Peptides (in silico digests for buttom-up proteomics)
Below you can find in silico digests of the whole proteome with Trypsin, Chymotrypsin, Trypsin+LysC, LysN, ArgC proteases suitable for different mass spec machines.| Try ESI |
 |
|---|
| ChTry ESI |
 |
|---|
| ArgC ESI |
 |
|---|
| LysN ESI |
 |
|---|
| TryLysC ESI |
 |
|---|
| Try MALDI |
 |
|---|
| ChTry MALDI |
 |
|---|
| ArgC MALDI |
 |
|---|
| LysN MALDI |
 |
|---|
| TryLysC MALDI |
 |
|---|
| Try LTQ |
 |
|---|
| ChTry LTQ |
 |
|---|
| ArgC LTQ |
 |
|---|
| LysN LTQ |
 |
|---|
| TryLysC LTQ |
 |
|---|
| Try MSlow |
 |
|---|
| ChTry MSlow |
 |
|---|
| ArgC MSlow |
 |
|---|
| LysN MSlow |
 |
|---|
| TryLysC MSlow |
 |
|---|
| Try MShigh |
 |
|---|
| ChTry MShigh |
 |
|---|
| ArgC MShigh |
 |
|---|
| LysN MShigh |
 |
|---|
| TryLysC MShigh |
 |
|---|
General Statistics
Number of major isoforms |
Number of additional isoforms |
Number of all proteins |
Number of amino acids |
Min. Seq. Length |
Max. Seq. Length |
Avg. Seq. Length |
Avg. Mol. Weight |
|---|---|---|---|---|---|---|---|
0 |
1161179 |
37 |
2469 |
328.7 |
35.09 |
Amino acid frequency
Ala |
Cys |
Asp |
Glu |
Phe |
Gly |
His |
Ile |
Lys |
Leu |
|---|---|---|---|---|---|---|---|---|---|
13.669 ± 0.059 | 0.544 ± 0.009 |
5.537 ± 0.041 | 5.997 ± 0.049 |
3.19 ± 0.025 | 9.004 ± 0.043 |
2.029 ± 0.018 | 4.638 ± 0.026 |
1.884 ± 0.033 | 10.324 ± 0.055 |
Met |
Asn |
Gln |
Pro |
Arg |
Ser |
Thr |
Val |
Trp |
Tyr |
|---|---|---|---|---|---|---|---|---|---|
1.833 ± 0.016 | 2.028 ± 0.023 |
5.554 ± 0.039 | 3.052 ± 0.024 |
7.044 ± 0.044 | 5.665 ± 0.026 |
6.342 ± 0.039 | 8.393 ± 0.042 |
1.416 ± 0.017 | 1.857 ± 0.018 |
Most of the basic statistics you can see at this page can be downloaded from this CSV file
Proteome-pI is available under Creative Commons Attribution-NoDerivs license, for more details see here
| Reference: Kozlowski LP. Proteome-pI 2.0: Proteome Isoelectric Point Database Update. Nucleic Acids Res. 2021, doi: 10.1093/nar/gkab944 | Contact: Lukasz P. Kozlowski |
