Segetibacter aerophilus
Taxonomy: cellular organisms; Bacteria; FCB group; Bacteroidetes/Chlorobi group; Bacteroidetes; Chitinophagia; Chitinophagales; Chitinophagaceae; Segetibacter
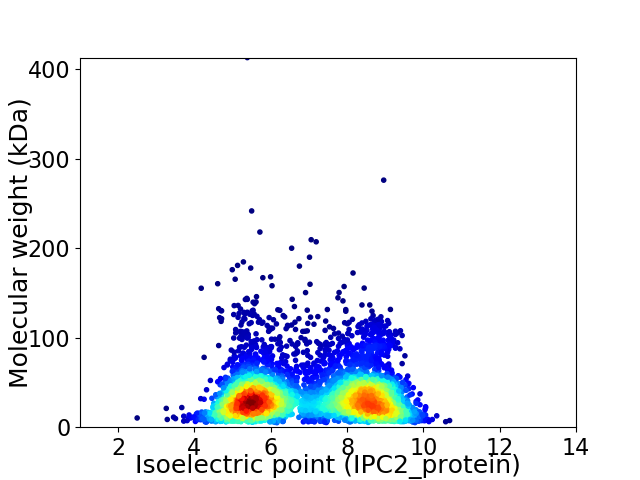
Average proteome isoelectric point is 6.98
Get precalculated fractions of proteins

Virtual 2D-PAGE plot for 4800 proteins (isoelectric point calculated using IPC2_protein)
Get csv file with sequences according to given criteria:
* You can choose from 21 different methods for calculating isoelectric point
Summary statistics related to proteome-wise predictions


Protein with the lowest isoelectric point:
>tr|A0A512BA12|A0A512BA12_9BACT Oxidoreductase OS=Segetibacter aerophilus OX=670293 GN=SAE01_13010 PE=4 SV=1
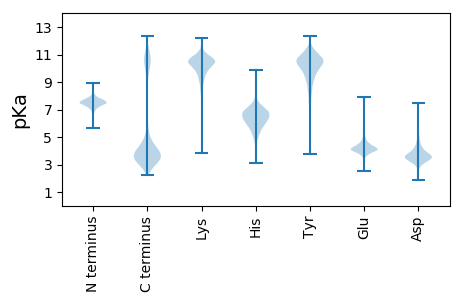
MM1 pKa = 7.49SCGNYY6 pKa = 9.71KK7 pKa = 10.05EE8 pKa = 5.32VEE10 pKa = 4.15VNYY13 pKa = 10.75CPDD16 pKa = 3.19AFLFSGYY23 pKa = 10.49DD24 pKa = 3.41YY25 pKa = 10.84EE26 pKa = 6.81AYY28 pKa = 10.6VQWQFKK34 pKa = 9.38NLNGQVVRR42 pKa = 11.84GDD44 pKa = 3.99ALTSALGVLEE54 pKa = 4.66LPVDD58 pKa = 4.33GSAGLTKK65 pKa = 10.7EE66 pKa = 4.15MFQHH70 pKa = 7.01FSGFWEE76 pKa = 4.45FRR78 pKa = 11.84SWGVDD83 pKa = 3.0SLGNIDD89 pKa = 4.74PFVFCQEE96 pKa = 4.15GEE98 pKa = 4.1PFDD101 pKa = 4.32FLVFKK106 pKa = 10.23FAFIDD111 pKa = 3.95PLPEE115 pKa = 4.57PNNINILFEE124 pKa = 4.43TCTMTT129 pKa = 4.82
MM1 pKa = 7.49SCGNYY6 pKa = 9.71KK7 pKa = 10.05EE8 pKa = 5.32VEE10 pKa = 4.15VNYY13 pKa = 10.75CPDD16 pKa = 3.19AFLFSGYY23 pKa = 10.49DD24 pKa = 3.41YY25 pKa = 10.84EE26 pKa = 6.81AYY28 pKa = 10.6VQWQFKK34 pKa = 9.38NLNGQVVRR42 pKa = 11.84GDD44 pKa = 3.99ALTSALGVLEE54 pKa = 4.66LPVDD58 pKa = 4.33GSAGLTKK65 pKa = 10.7EE66 pKa = 4.15MFQHH70 pKa = 7.01FSGFWEE76 pKa = 4.45FRR78 pKa = 11.84SWGVDD83 pKa = 3.0SLGNIDD89 pKa = 4.74PFVFCQEE96 pKa = 4.15GEE98 pKa = 4.1PFDD101 pKa = 4.32FLVFKK106 pKa = 10.23FAFIDD111 pKa = 3.95PLPEE115 pKa = 4.57PNNINILFEE124 pKa = 4.43TCTMTT129 pKa = 4.82
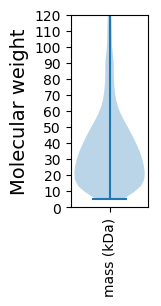
Molecular weight: 14.67 kDa
Isoelectric point according different methods:
Protein with the highest isoelectric point:
>tr|A0A512BH55|A0A512BH55_9BACT Uncharacterized protein OS=Segetibacter aerophilus OX=670293 GN=SAE01_36430 PE=4 SV=1
MM1 pKa = 7.23LAARR5 pKa = 11.84IITGLFGGVIGSISLAIVADD25 pKa = 4.02LFDD28 pKa = 3.01IHH30 pKa = 7.23HH31 pKa = 7.54RR32 pKa = 11.84GRR34 pKa = 11.84VMGFVQMGFGASQVLGVHH52 pKa = 6.34IGLYY56 pKa = 9.76LANNLGWRR64 pKa = 11.84APFCLVVAMGTLIAVLIVAKK84 pKa = 10.07LKK86 pKa = 10.6PVTAHH91 pKa = 7.42LSAQHH96 pKa = 5.89SRR98 pKa = 11.84TPLRR102 pKa = 11.84YY103 pKa = 9.67LLNTFSKK110 pKa = 9.79RR111 pKa = 11.84NYY113 pKa = 9.72RR114 pKa = 11.84IRR116 pKa = 11.84FLATAFLSIGGFTMMPFSSAFAVNNLKK143 pKa = 8.35VTHH146 pKa = 6.16EE147 pKa = 3.95QLPLLFMVSGCSSLVIMPLIGRR169 pKa = 11.84IADD172 pKa = 4.89RR173 pKa = 11.84INKK176 pKa = 6.56FTLYY180 pKa = 9.73TIASALMIVVVVVYY194 pKa = 10.04TNMSVTPLAWFLPLHH209 pKa = 6.23
MM1 pKa = 7.23LAARR5 pKa = 11.84IITGLFGGVIGSISLAIVADD25 pKa = 4.02LFDD28 pKa = 3.01IHH30 pKa = 7.23HH31 pKa = 7.54RR32 pKa = 11.84GRR34 pKa = 11.84VMGFVQMGFGASQVLGVHH52 pKa = 6.34IGLYY56 pKa = 9.76LANNLGWRR64 pKa = 11.84APFCLVVAMGTLIAVLIVAKK84 pKa = 10.07LKK86 pKa = 10.6PVTAHH91 pKa = 7.42LSAQHH96 pKa = 5.89SRR98 pKa = 11.84TPLRR102 pKa = 11.84YY103 pKa = 9.67LLNTFSKK110 pKa = 9.79RR111 pKa = 11.84NYY113 pKa = 9.72RR114 pKa = 11.84IRR116 pKa = 11.84FLATAFLSIGGFTMMPFSSAFAVNNLKK143 pKa = 8.35VTHH146 pKa = 6.16EE147 pKa = 3.95QLPLLFMVSGCSSLVIMPLIGRR169 pKa = 11.84IADD172 pKa = 4.89RR173 pKa = 11.84INKK176 pKa = 6.56FTLYY180 pKa = 9.73TIASALMIVVVVVYY194 pKa = 10.04TNMSVTPLAWFLPLHH209 pKa = 6.23
Molecular weight: 22.83 kDa
Isoelectric point according different methods:
Peptides (in silico digests for buttom-up proteomics)
Below you can find in silico digests of the whole proteome with Trypsin, Chymotrypsin, Trypsin+LysC, LysN, ArgC proteases suitable for different mass spec machines.| Try ESI |
 |
|---|
| ChTry ESI |
 |
|---|
| ArgC ESI |
 |
|---|
| LysN ESI |
 |
|---|
| TryLysC ESI |
 |
|---|
| Try MALDI |
 |
|---|
| ChTry MALDI |
 |
|---|
| ArgC MALDI |
 |
|---|
| LysN MALDI |
 |
|---|
| TryLysC MALDI |
 |
|---|
| Try LTQ |
 |
|---|
| ChTry LTQ |
 |
|---|
| ArgC LTQ |
 |
|---|
| LysN LTQ |
 |
|---|
| TryLysC LTQ |
 |
|---|
| Try MSlow |
 |
|---|
| ChTry MSlow |
 |
|---|
| ArgC MSlow |
 |
|---|
| LysN MSlow |
 |
|---|
| TryLysC MSlow |
 |
|---|
| Try MShigh |
 |
|---|
| ChTry MShigh |
 |
|---|
| ArgC MShigh |
 |
|---|
| LysN MShigh |
 |
|---|
| TryLysC MShigh |
 |
|---|
General Statistics
Number of major isoforms |
Number of additional isoforms |
Number of all proteins |
Number of amino acids |
Min. Seq. Length |
Max. Seq. Length |
Avg. Seq. Length |
Avg. Mol. Weight |
|---|---|---|---|---|---|---|---|
0 |
1634465 |
47 |
3654 |
340.5 |
38.17 |
Amino acid frequency
Ala |
Cys |
Asp |
Glu |
Phe |
Gly |
His |
Ile |
Lys |
Leu |
|---|---|---|---|---|---|---|---|---|---|
7.311 ± 0.037 | 0.807 ± 0.01 |
5.146 ± 0.024 | 5.919 ± 0.043 |
4.984 ± 0.023 | 6.847 ± 0.037 |
1.803 ± 0.016 | 7.065 ± 0.031 |
7.286 ± 0.037 | 9.116 ± 0.037 |
Met |
Asn |
Gln |
Pro |
Arg |
Ser |
Thr |
Val |
Trp |
Tyr |
|---|---|---|---|---|---|---|---|---|---|
2.248 ± 0.018 | 5.701 ± 0.034 |
3.893 ± 0.02 | 3.667 ± 0.019 |
4.005 ± 0.021 | 6.479 ± 0.033 |
5.911 ± 0.036 | 6.661 ± 0.023 |
1.229 ± 0.016 | 3.923 ± 0.024 |
Most of the basic statistics you can see at this page can be downloaded from this CSV file
Proteome-pI is available under Creative Commons Attribution-NoDerivs license, for more details see here
| Reference: Kozlowski LP. Proteome-pI 2.0: Proteome Isoelectric Point Database Update. Nucleic Acids Res. 2021, doi: 10.1093/nar/gkab944 | Contact: Lukasz P. Kozlowski |
