Acidianus filamentous virus 1 (isolate United States/Yellowstone) (AFV-1)
Taxonomy: Viruses; Adnaviria; Zilligvirae; Taleaviricota; Tokiviricetes; Ligamenvirales; Lipothrixviridae; Gammalipothrixvirus; Acidianus filamentous virus 1
Average proteome isoelectric point is 6.46
Get precalculated fractions of proteins

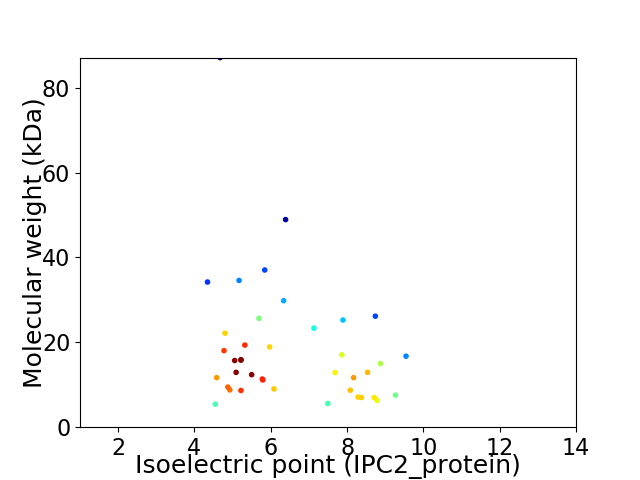
Virtual 2D-PAGE plot for 40 proteins (isoelectric point calculated using IPC2_protein)
Get csv file with sequences according to given criteria:
* You can choose from 21 different methods for calculating isoelectric point
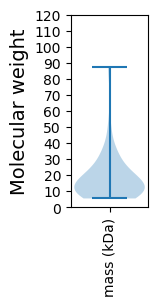
Summary statistics related to proteome-wise predictions


Protein with the lowest isoelectric point:
>sp|Q70LC1|Y055_AFV1Y Uncharacterized protein ORF55 OS=Acidianus filamentous virus 1 (isolate United States/Yellowstone) OX=654909 GN=ORF55 PE=4 SV=1
MM1 pKa = 6.46TRR3 pKa = 11.84RR4 pKa = 11.84YY5 pKa = 9.59RR6 pKa = 11.84SNPAVIPVPFPVPLPITEE24 pKa = 4.1QTTPQIPPPSPTAIQFTCFGIPIYY48 pKa = 10.33QSPSVPKK55 pKa = 9.82SYY57 pKa = 11.15AVVNVVSHH65 pKa = 5.72NVFYY69 pKa = 10.93GCSGDD74 pKa = 3.46TCFEE78 pKa = 4.0GVEE81 pKa = 4.37GVDD84 pKa = 2.81IRR86 pKa = 11.84SFVFLPINLFAYY98 pKa = 9.57IFACEE103 pKa = 4.33APLEE107 pKa = 4.32TQEE110 pKa = 4.29TQGTQTIIVITEE122 pKa = 3.97SKK124 pKa = 10.26PLYY127 pKa = 9.3NTDD130 pKa = 3.8KK131 pKa = 10.01VTQVNQIVQGQFTDD145 pKa = 3.2KK146 pKa = 11.47SEE148 pKa = 4.13VLSINYY154 pKa = 9.96GDD156 pKa = 4.54VNVTDD161 pKa = 3.7INYY164 pKa = 10.19LSFIQTGLQIATKK177 pKa = 8.99FTLPLCDD184 pKa = 4.75RR185 pKa = 11.84ISIFKK190 pKa = 9.88TPFEE194 pKa = 3.99LAVAKK199 pKa = 9.36TLYY202 pKa = 10.81LEE204 pKa = 4.3IVGKK208 pKa = 9.66EE209 pKa = 3.92RR210 pKa = 11.84PEE212 pKa = 3.6LTAILDD218 pKa = 4.01FMQSLDD224 pKa = 3.84AEE226 pKa = 4.04ISGIIEE232 pKa = 3.64TDD234 pKa = 3.55YY235 pKa = 11.72QEE237 pKa = 4.65IEE239 pKa = 4.35PNGKK243 pKa = 8.48LTDD246 pKa = 4.18VISKK250 pKa = 9.06PIQNQLPLQILPGLILGEE268 pKa = 4.01SYY270 pKa = 10.98QFNTNNILMQTEE282 pKa = 4.11IEE284 pKa = 4.31TEE286 pKa = 3.69IGEE289 pKa = 4.26QLYY292 pKa = 10.1TDD294 pKa = 5.49GITFEE299 pKa = 4.46TEE301 pKa = 3.8LTVKK305 pKa = 10.56QSS307 pKa = 2.94
MM1 pKa = 6.46TRR3 pKa = 11.84RR4 pKa = 11.84YY5 pKa = 9.59RR6 pKa = 11.84SNPAVIPVPFPVPLPITEE24 pKa = 4.1QTTPQIPPPSPTAIQFTCFGIPIYY48 pKa = 10.33QSPSVPKK55 pKa = 9.82SYY57 pKa = 11.15AVVNVVSHH65 pKa = 5.72NVFYY69 pKa = 10.93GCSGDD74 pKa = 3.46TCFEE78 pKa = 4.0GVEE81 pKa = 4.37GVDD84 pKa = 2.81IRR86 pKa = 11.84SFVFLPINLFAYY98 pKa = 9.57IFACEE103 pKa = 4.33APLEE107 pKa = 4.32TQEE110 pKa = 4.29TQGTQTIIVITEE122 pKa = 3.97SKK124 pKa = 10.26PLYY127 pKa = 9.3NTDD130 pKa = 3.8KK131 pKa = 10.01VTQVNQIVQGQFTDD145 pKa = 3.2KK146 pKa = 11.47SEE148 pKa = 4.13VLSINYY154 pKa = 9.96GDD156 pKa = 4.54VNVTDD161 pKa = 3.7INYY164 pKa = 10.19LSFIQTGLQIATKK177 pKa = 8.99FTLPLCDD184 pKa = 4.75RR185 pKa = 11.84ISIFKK190 pKa = 9.88TPFEE194 pKa = 3.99LAVAKK199 pKa = 9.36TLYY202 pKa = 10.81LEE204 pKa = 4.3IVGKK208 pKa = 9.66EE209 pKa = 3.92RR210 pKa = 11.84PEE212 pKa = 3.6LTAILDD218 pKa = 4.01FMQSLDD224 pKa = 3.84AEE226 pKa = 4.04ISGIIEE232 pKa = 3.64TDD234 pKa = 3.55YY235 pKa = 11.72QEE237 pKa = 4.65IEE239 pKa = 4.35PNGKK243 pKa = 8.48LTDD246 pKa = 4.18VISKK250 pKa = 9.06PIQNQLPLQILPGLILGEE268 pKa = 4.01SYY270 pKa = 10.98QFNTNNILMQTEE282 pKa = 4.11IEE284 pKa = 4.31TEE286 pKa = 3.69IGEE289 pKa = 4.26QLYY292 pKa = 10.1TDD294 pKa = 5.49GITFEE299 pKa = 4.46TEE301 pKa = 3.8LTVKK305 pKa = 10.56QSS307 pKa = 2.94
Molecular weight: 34.21 kDa
Isoelectric point according different methods:
Protein with the highest isoelectric point:
>sp|Q70LE0|Y166_AFV1Y Uncharacterized protein ORF166 OS=Acidianus filamentous virus 1 (isolate United States/Yellowstone) OX=654909 GN=ORF166 PE=4 SV=1
MM1 pKa = 7.49TIVNILRR8 pKa = 11.84VDD10 pKa = 3.31IDD12 pKa = 3.61QPFDD16 pKa = 3.58YY17 pKa = 10.55LDD19 pKa = 3.34KK20 pKa = 11.09QFYY23 pKa = 11.17GNLTLRR29 pKa = 11.84KK30 pKa = 8.98LLVWRR35 pKa = 11.84IFYY38 pKa = 9.94VSKK41 pKa = 10.85VFSQHH46 pKa = 5.41VEE48 pKa = 3.75SLEE51 pKa = 3.9FRR53 pKa = 11.84KK54 pKa = 10.41SLSGNIHH61 pKa = 5.71VLVTINPGIQRR72 pKa = 11.84TLVPLAQFLMGDD84 pKa = 3.77DD85 pKa = 3.56IMRR88 pKa = 11.84TFMNLKK94 pKa = 10.22RR95 pKa = 11.84KK96 pKa = 10.03GKK98 pKa = 9.79GNYY101 pKa = 9.02LFSYY105 pKa = 10.56GNTDD109 pKa = 3.08ADD111 pKa = 3.61RR112 pKa = 11.84FLAEE116 pKa = 3.69RR117 pKa = 11.84QIARR121 pKa = 11.84KK122 pKa = 9.29QKK124 pKa = 9.71ALNRR128 pKa = 11.84KK129 pKa = 8.9KK130 pKa = 10.86SKK132 pKa = 9.56TKK134 pKa = 10.2NGEE137 pKa = 3.89KK138 pKa = 10.37NGEE141 pKa = 4.23GKK143 pKa = 10.25SS144 pKa = 3.52
MM1 pKa = 7.49TIVNILRR8 pKa = 11.84VDD10 pKa = 3.31IDD12 pKa = 3.61QPFDD16 pKa = 3.58YY17 pKa = 10.55LDD19 pKa = 3.34KK20 pKa = 11.09QFYY23 pKa = 11.17GNLTLRR29 pKa = 11.84KK30 pKa = 8.98LLVWRR35 pKa = 11.84IFYY38 pKa = 9.94VSKK41 pKa = 10.85VFSQHH46 pKa = 5.41VEE48 pKa = 3.75SLEE51 pKa = 3.9FRR53 pKa = 11.84KK54 pKa = 10.41SLSGNIHH61 pKa = 5.71VLVTINPGIQRR72 pKa = 11.84TLVPLAQFLMGDD84 pKa = 3.77DD85 pKa = 3.56IMRR88 pKa = 11.84TFMNLKK94 pKa = 10.22RR95 pKa = 11.84KK96 pKa = 10.03GKK98 pKa = 9.79GNYY101 pKa = 9.02LFSYY105 pKa = 10.56GNTDD109 pKa = 3.08ADD111 pKa = 3.61RR112 pKa = 11.84FLAEE116 pKa = 3.69RR117 pKa = 11.84QIARR121 pKa = 11.84KK122 pKa = 9.29QKK124 pKa = 9.71ALNRR128 pKa = 11.84KK129 pKa = 8.9KK130 pKa = 10.86SKK132 pKa = 9.56TKK134 pKa = 10.2NGEE137 pKa = 3.89KK138 pKa = 10.37NGEE141 pKa = 4.23GKK143 pKa = 10.25SS144 pKa = 3.52
Molecular weight: 16.73 kDa
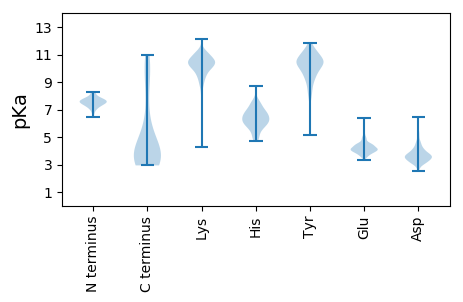
Isoelectric point according different methods:
Peptides (in silico digests for buttom-up proteomics)
Below you can find in silico digests of the whole proteome with Trypsin, Chymotrypsin, Trypsin+LysC, LysN, ArgC proteases suitable for different mass spec machines.| Try ESI |
 |
|---|
| ChTry ESI |
 |
|---|
| ArgC ESI |
 |
|---|
| LysN ESI |
 |
|---|
| TryLysC ESI |
 |
|---|
| Try MALDI |
 |
|---|
| ChTry MALDI |
 |
|---|
| ArgC MALDI |
 |
|---|
| LysN MALDI |
 |
|---|
| TryLysC MALDI |
 |
|---|
| Try LTQ |
 |
|---|
| ChTry LTQ |
 |
|---|
| ArgC LTQ |
 |
|---|
| LysN LTQ |
 |
|---|
| TryLysC LTQ |
 |
|---|
| Try MSlow |
 |
|---|
| ChTry MSlow |
 |
|---|
| ArgC MSlow |
 |
|---|
| LysN MSlow |
 |
|---|
| TryLysC MSlow |
 |
|---|
| Try MShigh |
 |
|---|
| ChTry MShigh |
 |
|---|
| ArgC MShigh |
 |
|---|
| LysN MShigh |
 |
|---|
| TryLysC MShigh |
 |
|---|
General Statistics
Number of major isoforms |
Number of additional isoforms |
Number of all proteins |
Number of amino acids |
Min. Seq. Length |
Max. Seq. Length |
Avg. Seq. Length |
Avg. Mol. Weight |
|---|---|---|---|---|---|---|---|
0 |
6405 |
48 |
807 |
160.1 |
18.36 |
Amino acid frequency
Ala |
Cys |
Asp |
Glu |
Phe |
Gly |
His |
Ile |
Lys |
Leu |
|---|---|---|---|---|---|---|---|---|---|
4.856 ± 0.346 | 1.311 ± 0.176 |
5.324 ± 0.377 | 7.244 ± 0.734 |
4.403 ± 0.289 | 5.402 ± 0.409 |
1.187 ± 0.17 | 8.603 ± 0.356 |
7.447 ± 0.738 | 9.446 ± 0.414 |
Met |
Asn |
Gln |
Pro |
Arg |
Ser |
Thr |
Val |
Trp |
Tyr |
|---|---|---|---|---|---|---|---|---|---|
2.623 ± 0.217 | 4.824 ± 0.216 |
3.497 ± 0.369 | 3.45 ± 0.48 |
4.387 ± 0.491 | 6.635 ± 0.467 |
5.605 ± 0.481 | 7.229 ± 0.282 |
0.906 ± 0.102 | 5.621 ± 0.387 |
Most of the basic statistics you can see at this page can be downloaded from this CSV file
Proteome-pI is available under Creative Commons Attribution-NoDerivs license, for more details see here
| Reference: Kozlowski LP. Proteome-pI 2.0: Proteome Isoelectric Point Database Update. Nucleic Acids Res. 2021, doi: 10.1093/nar/gkab944 | Contact: Lukasz P. Kozlowski |
