Auricularia subglabra (strain TFB-10046 / SS5) (White-rot fungus) (Auricularia delicata (strain TFB10046))
Taxonomy: cellular organisms; Eukaryota; Opisthokonta; Fungi; Dikarya; Basidiomycota; Agaricomycotina; Agaricomycetes; Agaricomycetes incertae sedis; Auriculariales; Auriculariaceae; Auricularia; Auricularia subglabra
Average proteome isoelectric point is 6.82
Get precalculated fractions of proteins

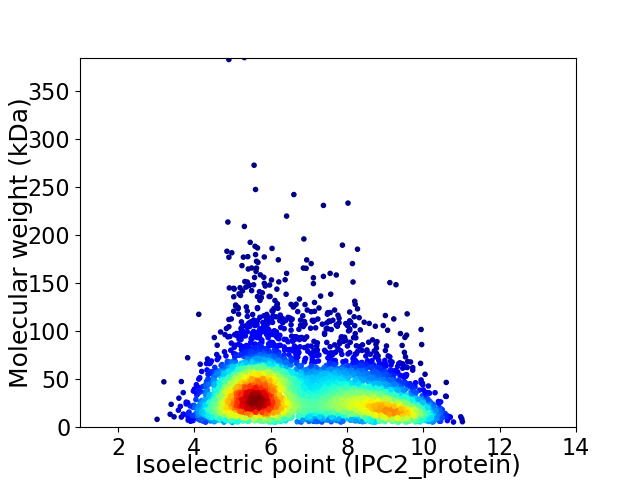
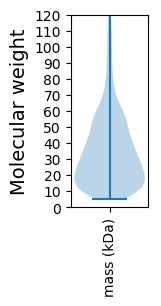
Virtual 2D-PAGE plot for 5290 proteins (isoelectric point calculated using IPC2_protein)
Get csv file with sequences according to given criteria:
* You can choose from 21 different methods for calculating isoelectric point
Summary statistics related to proteome-wise predictions


Protein with the lowest isoelectric point:
>tr|J0CPW2|J0CPW2_AURST Uncharacterized protein OS=Auricularia subglabra (strain TFB-10046 / SS5) OX=717982 GN=AURDEDRAFT_178730 PE=4 SV=1
MM1 pKa = 7.89ANPDD5 pKa = 3.92LPTAGDD11 pKa = 3.8ARR13 pKa = 11.84AEE15 pKa = 4.29DD16 pKa = 4.59DD17 pKa = 4.61DD18 pKa = 5.06PSFFYY23 pKa = 10.84LPPEE27 pKa = 3.78AWTTDD32 pKa = 3.15STSPSIHH39 pKa = 6.09SQSSLHH45 pKa = 5.55LTRR48 pKa = 11.84SQNAEE53 pKa = 3.68VFFVFNGTLVDD64 pKa = 4.91DD65 pKa = 5.11GAATVLSSYY74 pKa = 8.53ATSWTAGQLLYY85 pKa = 10.47TSPVLSAAQHH95 pKa = 4.94VVQFTNIAEE104 pKa = 4.48GAPFGVDD111 pKa = 2.74YY112 pKa = 11.3IMYY115 pKa = 9.93FRR117 pKa = 11.84STDD120 pKa = 4.21DD121 pKa = 5.93DD122 pKa = 6.07DD123 pKa = 7.78DD124 pKa = 7.58DD125 pKa = 7.67DD126 pKa = 7.59DD127 pKa = 7.67DD128 pKa = 7.59DD129 pKa = 7.55DD130 pKa = 7.23DD131 pKa = 7.55DD132 pKa = 5.65EE133 pKa = 4.68AQQWRR138 pKa = 11.84SGAPLADD145 pKa = 3.51RR146 pKa = 11.84RR147 pKa = 11.84NCGDD151 pKa = 3.86SPCGASGGSSGAVPTT166 pKa = 4.61
MM1 pKa = 7.89ANPDD5 pKa = 3.92LPTAGDD11 pKa = 3.8ARR13 pKa = 11.84AEE15 pKa = 4.29DD16 pKa = 4.59DD17 pKa = 4.61DD18 pKa = 5.06PSFFYY23 pKa = 10.84LPPEE27 pKa = 3.78AWTTDD32 pKa = 3.15STSPSIHH39 pKa = 6.09SQSSLHH45 pKa = 5.55LTRR48 pKa = 11.84SQNAEE53 pKa = 3.68VFFVFNGTLVDD64 pKa = 4.91DD65 pKa = 5.11GAATVLSSYY74 pKa = 8.53ATSWTAGQLLYY85 pKa = 10.47TSPVLSAAQHH95 pKa = 4.94VVQFTNIAEE104 pKa = 4.48GAPFGVDD111 pKa = 2.74YY112 pKa = 11.3IMYY115 pKa = 9.93FRR117 pKa = 11.84STDD120 pKa = 4.21DD121 pKa = 5.93DD122 pKa = 6.07DD123 pKa = 7.78DD124 pKa = 7.58DD125 pKa = 7.67DD126 pKa = 7.59DD127 pKa = 7.67DD128 pKa = 7.59DD129 pKa = 7.55DD130 pKa = 7.23DD131 pKa = 7.55DD132 pKa = 5.65EE133 pKa = 4.68AQQWRR138 pKa = 11.84SGAPLADD145 pKa = 3.51RR146 pKa = 11.84RR147 pKa = 11.84NCGDD151 pKa = 3.86SPCGASGGSSGAVPTT166 pKa = 4.61
Molecular weight: 17.7 kDa
Isoelectric point according different methods:
Protein with the highest isoelectric point:
>tr|J0CS47|J0CS47_AURST Uncharacterized protein OS=Auricularia subglabra (strain TFB-10046 / SS5) OX=717982 GN=AURDEDRAFT_177832 PE=4 SV=1
MM1 pKa = 7.83PSGAAPVHH9 pKa = 5.52GLARR13 pKa = 11.84RR14 pKa = 11.84PRR16 pKa = 11.84VFPFWSATCPVQNARR31 pKa = 11.84SSPRR35 pKa = 11.84VAQPLFPLQPTVPRR49 pKa = 11.84RR50 pKa = 11.84ILLPAPLVSLLVRR63 pKa = 11.84GSASVRR69 pKa = 11.84QAGSAFRR76 pKa = 11.84GAGAARR82 pKa = 11.84YY83 pKa = 8.15KK84 pKa = 10.87SPAQARR90 pKa = 11.84TPNAFSRR97 pKa = 11.84RR98 pKa = 11.84SRR100 pKa = 11.84PP101 pKa = 3.26
MM1 pKa = 7.83PSGAAPVHH9 pKa = 5.52GLARR13 pKa = 11.84RR14 pKa = 11.84PRR16 pKa = 11.84VFPFWSATCPVQNARR31 pKa = 11.84SSPRR35 pKa = 11.84VAQPLFPLQPTVPRR49 pKa = 11.84RR50 pKa = 11.84ILLPAPLVSLLVRR63 pKa = 11.84GSASVRR69 pKa = 11.84QAGSAFRR76 pKa = 11.84GAGAARR82 pKa = 11.84YY83 pKa = 8.15KK84 pKa = 10.87SPAQARR90 pKa = 11.84TPNAFSRR97 pKa = 11.84RR98 pKa = 11.84SRR100 pKa = 11.84PP101 pKa = 3.26
Molecular weight: 10.82 kDa
Isoelectric point according different methods:
Peptides (in silico digests for buttom-up proteomics)
Below you can find in silico digests of the whole proteome with Trypsin, Chymotrypsin, Trypsin+LysC, LysN, ArgC proteases suitable for different mass spec machines.| Try ESI |
 |
|---|
| ChTry ESI |
 |
|---|
| ArgC ESI |
 |
|---|
| LysN ESI |
 |
|---|
| TryLysC ESI |
 |
|---|
| Try MALDI |
 |
|---|
| ChTry MALDI |
 |
|---|
| ArgC MALDI |
 |
|---|
| LysN MALDI |
 |
|---|
| TryLysC MALDI |
 |
|---|
| Try LTQ |
 |
|---|
| ChTry LTQ |
 |
|---|
| ArgC LTQ |
 |
|---|
| LysN LTQ |
 |
|---|
| TryLysC LTQ |
 |
|---|
| Try MSlow |
 |
|---|
| ChTry MSlow |
 |
|---|
| ArgC MSlow |
 |
|---|
| LysN MSlow |
 |
|---|
| TryLysC MSlow |
 |
|---|
| Try MShigh |
 |
|---|
| ChTry MShigh |
 |
|---|
| ArgC MShigh |
 |
|---|
| LysN MShigh |
 |
|---|
| TryLysC MShigh |
 |
|---|
General Statistics
Number of major isoforms |
Number of additional isoforms |
Number of all proteins |
Number of amino acids |
Min. Seq. Length |
Max. Seq. Length |
Avg. Seq. Length |
Avg. Mol. Weight |
|---|---|---|---|---|---|---|---|
0 |
1838300 |
49 |
3552 |
347.5 |
38.22 |
Amino acid frequency
Ala |
Cys |
Asp |
Glu |
Phe |
Gly |
His |
Ile |
Lys |
Leu |
|---|---|---|---|---|---|---|---|---|---|
10.788 ± 0.043 | 1.658 ± 0.018 |
5.889 ± 0.027 | 5.391 ± 0.034 |
3.538 ± 0.021 | 6.418 ± 0.033 |
2.798 ± 0.017 | 3.931 ± 0.025 |
3.5 ± 0.03 | 9.579 ± 0.048 |
Met |
Asn |
Gln |
Pro |
Arg |
Ser |
Thr |
Val |
Trp |
Tyr |
|---|---|---|---|---|---|---|---|---|---|
1.946 ± 0.012 | 2.77 ± 0.017 |
7.126 ± 0.043 | 3.49 ± 0.024 |
7.449 ± 0.034 | 7.574 ± 0.034 |
5.629 ± 0.02 | 6.585 ± 0.026 |
1.579 ± 0.013 | 2.361 ± 0.017 |
Most of the basic statistics you can see at this page can be downloaded from this CSV file
Proteome-pI is available under Creative Commons Attribution-NoDerivs license, for more details see here
| Reference: Kozlowski LP. Proteome-pI 2.0: Proteome Isoelectric Point Database Update. Nucleic Acids Res. 2021, doi: 10.1093/nar/gkab944 | Contact: Lukasz P. Kozlowski |
