Escherichia phage chee24
Taxonomy: Viruses; Duplodnaviria; Heunggongvirae; Uroviricota; Caudoviricetes; Caudovirales; Demerecviridae; Markadamsvirinae; Tequintavirus; Escherichia virus chee24
Average proteome isoelectric point is 6.16
Get precalculated fractions of proteins
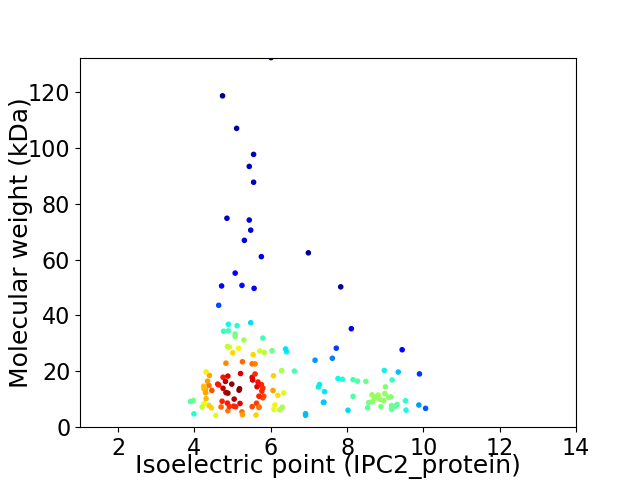
Virtual 2D-PAGE plot for 153 proteins (isoelectric point calculated using IPC2_protein)
Get csv file with sequences according to given criteria:
* You can choose from 21 different methods for calculating isoelectric point
Summary statistics related to proteome-wise predictions


Protein with the lowest isoelectric point:
>tr|A0A2K8HP56|A0A2K8HP56_9CAUD Tail length tape-measure protein OS=Escherichia phage chee24 OX=2024330 GN=P24_0132 PE=4 SV=1
MM1 pKa = 7.47SIVKK5 pKa = 9.69SVYY8 pKa = 7.53THH10 pKa = 7.3PDD12 pKa = 3.83DD13 pKa = 4.1IFVWADD19 pKa = 3.15GSWCYY24 pKa = 10.27RR25 pKa = 11.84CEE27 pKa = 4.03LWEE30 pKa = 4.28MDD32 pKa = 4.5YY33 pKa = 11.4KK34 pKa = 11.19SDD36 pKa = 3.93DD37 pKa = 3.5YY38 pKa = 11.91GVIYY42 pKa = 10.63VDD44 pKa = 3.28TVEE47 pKa = 4.3YY48 pKa = 8.99DD49 pKa = 3.32TFLEE53 pKa = 4.23RR54 pKa = 11.84DD55 pKa = 3.42KK56 pKa = 11.68NGNKK60 pKa = 9.89
MM1 pKa = 7.47SIVKK5 pKa = 9.69SVYY8 pKa = 7.53THH10 pKa = 7.3PDD12 pKa = 3.83DD13 pKa = 4.1IFVWADD19 pKa = 3.15GSWCYY24 pKa = 10.27RR25 pKa = 11.84CEE27 pKa = 4.03LWEE30 pKa = 4.28MDD32 pKa = 4.5YY33 pKa = 11.4KK34 pKa = 11.19SDD36 pKa = 3.93DD37 pKa = 3.5YY38 pKa = 11.91GVIYY42 pKa = 10.63VDD44 pKa = 3.28TVEE47 pKa = 4.3YY48 pKa = 8.99DD49 pKa = 3.32TFLEE53 pKa = 4.23RR54 pKa = 11.84DD55 pKa = 3.42KK56 pKa = 11.68NGNKK60 pKa = 9.89
Molecular weight: 7.21 kDa
Isoelectric point according different methods:
Protein with the highest isoelectric point:
>tr|A0A2K8H8W3|A0A2K8H8W3_9CAUD Ribonucleotide reductase of class III (Anaerobic) large subunit OS=Escherichia phage chee24 OX=2024330 GN=P24_0098 PE=4 SV=1
MM1 pKa = 7.79AKK3 pKa = 9.77QKK5 pKa = 10.18NAKK8 pKa = 7.58TQAAPAVKK16 pKa = 9.39TFPKK20 pKa = 10.24TEE22 pKa = 4.13ANRR25 pKa = 11.84KK26 pKa = 8.94ARR28 pKa = 11.84LEE30 pKa = 3.84RR31 pKa = 11.84HH32 pKa = 5.4LRR34 pKa = 11.84KK35 pKa = 10.0HH36 pKa = 5.6PTDD39 pKa = 3.49AQAAQALNNPAPIRR53 pKa = 11.84QKK55 pKa = 10.71PKK57 pKa = 10.52AKK59 pKa = 9.68NATRR63 pKa = 11.84KK64 pKa = 8.39SYY66 pKa = 11.17KK67 pKa = 8.89MVMYY71 pKa = 10.31VEE73 pKa = 4.89NYY75 pKa = 7.4GHH77 pKa = 6.99KK78 pKa = 9.99SVPVSLSFNAGAEE91 pKa = 4.17LFSRR95 pKa = 11.84NGMSMKK101 pKa = 10.42DD102 pKa = 3.33YY103 pKa = 11.01EE104 pKa = 4.31KK105 pKa = 10.98AVNQKK110 pKa = 9.97RR111 pKa = 11.84KK112 pKa = 8.13PTADD116 pKa = 3.13VLRR119 pKa = 11.84DD120 pKa = 3.4TRR122 pKa = 11.84GQFGSVKK129 pKa = 9.73PNIFGVEE136 pKa = 3.85YY137 pKa = 11.02SKK139 pKa = 11.81DD140 pKa = 3.37NVRR143 pKa = 11.84ALCYY147 pKa = 10.2GVGIKK152 pKa = 8.51FTGDD156 pKa = 3.22SARR159 pKa = 11.84KK160 pKa = 7.85SAKK163 pKa = 9.24PARR166 pKa = 11.84KK167 pKa = 9.36RR168 pKa = 11.84KK169 pKa = 9.78AKK171 pKa = 10.37
MM1 pKa = 7.79AKK3 pKa = 9.77QKK5 pKa = 10.18NAKK8 pKa = 7.58TQAAPAVKK16 pKa = 9.39TFPKK20 pKa = 10.24TEE22 pKa = 4.13ANRR25 pKa = 11.84KK26 pKa = 8.94ARR28 pKa = 11.84LEE30 pKa = 3.84RR31 pKa = 11.84HH32 pKa = 5.4LRR34 pKa = 11.84KK35 pKa = 10.0HH36 pKa = 5.6PTDD39 pKa = 3.49AQAAQALNNPAPIRR53 pKa = 11.84QKK55 pKa = 10.71PKK57 pKa = 10.52AKK59 pKa = 9.68NATRR63 pKa = 11.84KK64 pKa = 8.39SYY66 pKa = 11.17KK67 pKa = 8.89MVMYY71 pKa = 10.31VEE73 pKa = 4.89NYY75 pKa = 7.4GHH77 pKa = 6.99KK78 pKa = 9.99SVPVSLSFNAGAEE91 pKa = 4.17LFSRR95 pKa = 11.84NGMSMKK101 pKa = 10.42DD102 pKa = 3.33YY103 pKa = 11.01EE104 pKa = 4.31KK105 pKa = 10.98AVNQKK110 pKa = 9.97RR111 pKa = 11.84KK112 pKa = 8.13PTADD116 pKa = 3.13VLRR119 pKa = 11.84DD120 pKa = 3.4TRR122 pKa = 11.84GQFGSVKK129 pKa = 9.73PNIFGVEE136 pKa = 3.85YY137 pKa = 11.02SKK139 pKa = 11.81DD140 pKa = 3.37NVRR143 pKa = 11.84ALCYY147 pKa = 10.2GVGIKK152 pKa = 8.51FTGDD156 pKa = 3.22SARR159 pKa = 11.84KK160 pKa = 7.85SAKK163 pKa = 9.24PARR166 pKa = 11.84KK167 pKa = 9.36RR168 pKa = 11.84KK169 pKa = 9.78AKK171 pKa = 10.37
Molecular weight: 19.08 kDa
Isoelectric point according different methods:
Peptides (in silico digests for buttom-up proteomics)
Below you can find in silico digests of the whole proteome with Trypsin, Chymotrypsin, Trypsin+LysC, LysN, ArgC proteases suitable for different mass spec machines.| Try ESI |
 |
|---|
| ChTry ESI |
|
|---|
| ArgC ESI |
|
|---|
| LysN ESI |
|
|---|
| TryLysC ESI |
|
|---|
| Try MALDI |
|
|---|
| ChTry MALDI |
|
|---|
| ArgC MALDI |
|
|---|
| LysN MALDI |
|
|---|
| TryLysC MALDI |
|
|---|
| Try LTQ |
|
|---|
| ChTry LTQ |
|
|---|
| ArgC LTQ |
|
|---|
| LysN LTQ |
|
|---|
| TryLysC LTQ |
|
|---|
| Try MSlow |
|
|---|
| ChTry MSlow |
|
|---|
| ArgC MSlow |
|
|---|
| LysN MSlow |
|
|---|
| TryLysC MSlow |
|
|---|
| Try MShigh |
|
|---|
| ChTry MShigh |
|
|---|
| ArgC MShigh |
|
|---|
| LysN MShigh |
|
|---|
| TryLysC MShigh |
|
|---|
General Statistics
Number of major isoforms |
Number of additional isoforms |
Number of all proteins |
Number of amino acids |
Min. Seq. Length |
Max. Seq. Length |
Avg. Seq. Length |
Avg. Mol. Weight |
|---|---|---|---|---|---|---|---|
0 |
30303 |
37 |
1226 |
198.1 |
22.23 |
Amino acid frequency
Ala |
Cys |
Asp |
Glu |
Phe |
Gly |
His |
Ile |
Lys |
Leu |
|---|---|---|---|---|---|---|---|---|---|
7.917 ± 0.37 | 1.079 ± 0.092 |
6.155 ± 0.152 | 7.075 ± 0.231 |
4.052 ± 0.129 | 6.643 ± 0.344 |
1.881 ± 0.118 | 6.448 ± 0.173 |
7.184 ± 0.262 | 8.336 ± 0.22 |
Met |
Asn |
Gln |
Pro |
Arg |
Ser |
Thr |
Val |
Trp |
Tyr |
|---|---|---|---|---|---|---|---|---|---|
2.69 ± 0.165 | 5.306 ± 0.171 |
3.455 ± 0.129 | 3.911 ± 0.218 |
4.31 ± 0.115 | 6.234 ± 0.168 |
5.689 ± 0.16 | 6.564 ± 0.173 |
1.221 ± 0.101 | 3.851 ± 0.154 |
Most of the basic statistics you can see at this page can be downloaded from this CSV file
See this proteome in:

Proteome-pI is available under Creative Commons Attribution-NoDerivs license, for more details see here
| Reference: Kozlowski LP. Proteome-pI 2.0: Proteome Isoelectric Point Database Update. Nucleic Acids Res. 2021, doi: 10.1093/nar/gkab944 | Contact: Lukasz P. Kozlowski |