Fibrobacter succinogenes (strain ATCC 19169 / S85)
Taxonomy: cellular organisms; Bacteria; FCB group; Fibrobacteres; Fibrobacteria; Fibrobacterales; Fibrobacteraceae; Fibrobacter; Fibrobacter succinogenes; Fibrobacter succinogenes subsp. succinogenes
Average proteome isoelectric point is 6.34
Get precalculated fractions of proteins

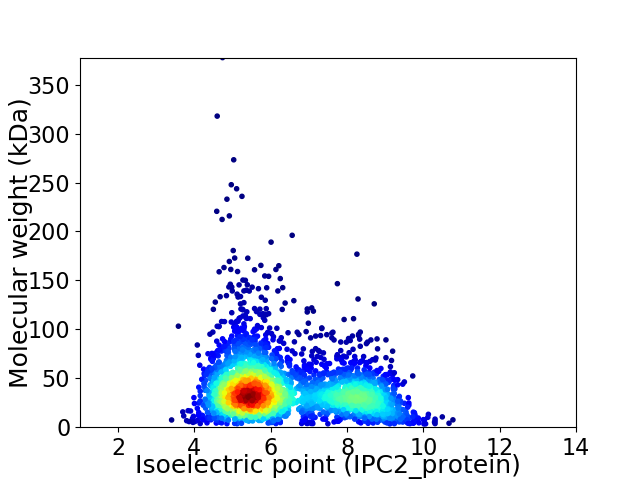
Virtual 2D-PAGE plot for 2871 proteins (isoelectric point calculated using IPC2_protein)
Get csv file with sequences according to given criteria:
* You can choose from 21 different methods for calculating isoelectric point
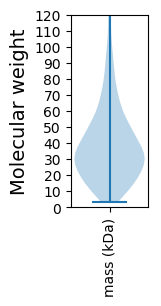
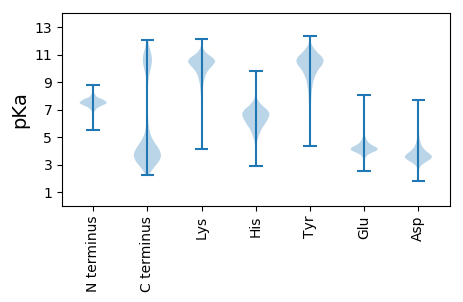
Summary statistics related to proteome-wise predictions


Protein with the lowest isoelectric point:
>tr|C9RN46|C9RN46_FIBSS Acetolactate synthase OS=Fibrobacter succinogenes (strain ATCC 19169 / S85) OX=59374 GN=ilvB PE=3 SV=1
MM1 pKa = 8.19DD2 pKa = 4.25CRR4 pKa = 11.84ILVRR8 pKa = 11.84FIGVQEE14 pKa = 4.75DD15 pKa = 4.99LDD17 pKa = 4.31ALWSAFMEE25 pKa = 4.39HH26 pKa = 6.38FPEE29 pKa = 6.13AEE31 pKa = 4.14LPSVDD36 pKa = 3.16SGEE39 pKa = 4.18WYY41 pKa = 10.53SVEE44 pKa = 5.78DD45 pKa = 3.89YY46 pKa = 7.74MTDD49 pKa = 3.03EE50 pKa = 4.35YY51 pKa = 11.31EE52 pKa = 4.34CRR54 pKa = 11.84FEE56 pKa = 4.37VLPEE60 pKa = 4.04SEE62 pKa = 5.39LYY64 pKa = 10.83AIDD67 pKa = 3.57GTFLVEE73 pKa = 4.31NEE75 pKa = 4.19PPEE78 pKa = 4.76DD79 pKa = 3.58VLTEE83 pKa = 3.54ILEE86 pKa = 4.24RR87 pKa = 11.84FEE89 pKa = 4.26RR90 pKa = 11.84VYY92 pKa = 11.32AVFKK96 pKa = 10.12WSTMDD101 pKa = 3.27VGVGCGTSEE110 pKa = 3.79GWGEE114 pKa = 4.13FNADD118 pKa = 3.92RR119 pKa = 11.84ADD121 pKa = 4.36DD122 pKa = 4.83GSDD125 pKa = 3.19EE126 pKa = 4.27ANEE129 pKa = 3.73ISEE132 pKa = 4.38AVLGFF137 pKa = 4.02
MM1 pKa = 8.19DD2 pKa = 4.25CRR4 pKa = 11.84ILVRR8 pKa = 11.84FIGVQEE14 pKa = 4.75DD15 pKa = 4.99LDD17 pKa = 4.31ALWSAFMEE25 pKa = 4.39HH26 pKa = 6.38FPEE29 pKa = 6.13AEE31 pKa = 4.14LPSVDD36 pKa = 3.16SGEE39 pKa = 4.18WYY41 pKa = 10.53SVEE44 pKa = 5.78DD45 pKa = 3.89YY46 pKa = 7.74MTDD49 pKa = 3.03EE50 pKa = 4.35YY51 pKa = 11.31EE52 pKa = 4.34CRR54 pKa = 11.84FEE56 pKa = 4.37VLPEE60 pKa = 4.04SEE62 pKa = 5.39LYY64 pKa = 10.83AIDD67 pKa = 3.57GTFLVEE73 pKa = 4.31NEE75 pKa = 4.19PPEE78 pKa = 4.76DD79 pKa = 3.58VLTEE83 pKa = 3.54ILEE86 pKa = 4.24RR87 pKa = 11.84FEE89 pKa = 4.26RR90 pKa = 11.84VYY92 pKa = 11.32AVFKK96 pKa = 10.12WSTMDD101 pKa = 3.27VGVGCGTSEE110 pKa = 3.79GWGEE114 pKa = 4.13FNADD118 pKa = 3.92RR119 pKa = 11.84ADD121 pKa = 4.36DD122 pKa = 4.83GSDD125 pKa = 3.19EE126 pKa = 4.27ANEE129 pKa = 3.73ISEE132 pKa = 4.38AVLGFF137 pKa = 4.02
Molecular weight: 15.62 kDa
Isoelectric point according different methods:
Protein with the highest isoelectric point:
>tr|D9S563|D9S563_FIBSS Hydrolase carbon-nitrogen family OS=Fibrobacter succinogenes (strain ATCC 19169 / S85) OX=59374 GN=FSU_0240 PE=4 SV=1
MM1 pKa = 8.07DD2 pKa = 4.96GKK4 pKa = 10.96LVLALSRR11 pKa = 11.84ASRR14 pKa = 11.84HH15 pKa = 4.57WSTGVTVGASAAKK28 pKa = 10.39LMEE31 pKa = 4.44AARR34 pKa = 11.84APRR37 pKa = 11.84VKK39 pKa = 10.23ILIVFIFAAPYY50 pKa = 9.61FLVSFSRR57 pKa = 11.84MLWYY61 pKa = 8.17RR62 pKa = 11.84TLRR65 pKa = 11.84SSSARR70 pKa = 11.84RR71 pKa = 11.84DD72 pKa = 3.29SSSFLSSFLAFSFSDD87 pKa = 3.26LAMASRR93 pKa = 11.84ISSSLCSASAWASSIFPSSFRR114 pKa = 11.84ALAATSLEE122 pKa = 4.17YY123 pKa = 10.91EE124 pKa = 4.28FDD126 pKa = 3.68VMLASSLFSLTSEE139 pKa = 4.5RR140 pKa = 11.84VASACPRR147 pKa = 11.84EE148 pKa = 4.01RR149 pKa = 11.84LIPLWLPEE157 pKa = 4.04QPVRR161 pKa = 11.84AARR164 pKa = 11.84ASVKK168 pKa = 9.78EE169 pKa = 3.94HH170 pKa = 6.44ANILAFIGASPMIDD184 pKa = 2.86IPRR187 pKa = 3.99
MM1 pKa = 8.07DD2 pKa = 4.96GKK4 pKa = 10.96LVLALSRR11 pKa = 11.84ASRR14 pKa = 11.84HH15 pKa = 4.57WSTGVTVGASAAKK28 pKa = 10.39LMEE31 pKa = 4.44AARR34 pKa = 11.84APRR37 pKa = 11.84VKK39 pKa = 10.23ILIVFIFAAPYY50 pKa = 9.61FLVSFSRR57 pKa = 11.84MLWYY61 pKa = 8.17RR62 pKa = 11.84TLRR65 pKa = 11.84SSSARR70 pKa = 11.84RR71 pKa = 11.84DD72 pKa = 3.29SSSFLSSFLAFSFSDD87 pKa = 3.26LAMASRR93 pKa = 11.84ISSSLCSASAWASSIFPSSFRR114 pKa = 11.84ALAATSLEE122 pKa = 4.17YY123 pKa = 10.91EE124 pKa = 4.28FDD126 pKa = 3.68VMLASSLFSLTSEE139 pKa = 4.5RR140 pKa = 11.84VASACPRR147 pKa = 11.84EE148 pKa = 4.01RR149 pKa = 11.84LIPLWLPEE157 pKa = 4.04QPVRR161 pKa = 11.84AARR164 pKa = 11.84ASVKK168 pKa = 9.78EE169 pKa = 3.94HH170 pKa = 6.44ANILAFIGASPMIDD184 pKa = 2.86IPRR187 pKa = 3.99
Molecular weight: 20.45 kDa
Isoelectric point according different methods:
Peptides (in silico digests for buttom-up proteomics)
Below you can find in silico digests of the whole proteome with Trypsin, Chymotrypsin, Trypsin+LysC, LysN, ArgC proteases suitable for different mass spec machines.| Try ESI |
 |
|---|
| ChTry ESI |
 |
|---|
| ArgC ESI |
 |
|---|
| LysN ESI |
 |
|---|
| TryLysC ESI |
 |
|---|
| Try MALDI |
 |
|---|
| ChTry MALDI |
 |
|---|
| ArgC MALDI |
 |
|---|
| LysN MALDI |
 |
|---|
| TryLysC MALDI |
 |
|---|
| Try LTQ |
 |
|---|
| ChTry LTQ |
 |
|---|
| ArgC LTQ |
 |
|---|
| LysN LTQ |
 |
|---|
| TryLysC LTQ |
 |
|---|
| Try MSlow |
 |
|---|
| ChTry MSlow |
 |
|---|
| ArgC MSlow |
 |
|---|
| LysN MSlow |
 |
|---|
| TryLysC MSlow |
 |
|---|
| Try MShigh |
 |
|---|
| ChTry MShigh |
 |
|---|
| ArgC MShigh |
 |
|---|
| LysN MShigh |
 |
|---|
| TryLysC MShigh |
 |
|---|
General Statistics
Number of major isoforms |
Number of additional isoforms |
Number of all proteins |
Number of amino acids |
Min. Seq. Length |
Max. Seq. Length |
Avg. Seq. Length |
Avg. Mol. Weight |
|---|---|---|---|---|---|---|---|
0 |
1073633 |
30 |
3318 |
374.0 |
41.78 |
Amino acid frequency
Ala |
Cys |
Asp |
Glu |
Phe |
Gly |
His |
Ile |
Lys |
Leu |
|---|---|---|---|---|---|---|---|---|---|
8.109 ± 0.051 | 1.4 ± 0.021 |
5.994 ± 0.037 | 6.551 ± 0.044 |
4.883 ± 0.035 | 6.951 ± 0.05 |
1.786 ± 0.017 | 6.14 ± 0.042 |
6.961 ± 0.037 | 8.716 ± 0.051 |
Met |
Asn |
Gln |
Pro |
Arg |
Ser |
Thr |
Val |
Trp |
Tyr |
|---|---|---|---|---|---|---|---|---|---|
2.601 ± 0.024 | 4.829 ± 0.036 |
3.799 ± 0.027 | 2.882 ± 0.024 |
4.462 ± 0.036 | 6.733 ± 0.053 |
5.236 ± 0.037 | 6.97 ± 0.043 |
1.282 ± 0.019 | 3.715 ± 0.027 |
Most of the basic statistics you can see at this page can be downloaded from this CSV file
Proteome-pI is available under Creative Commons Attribution-NoDerivs license, for more details see here
| Reference: Kozlowski LP. Proteome-pI 2.0: Proteome Isoelectric Point Database Update. Nucleic Acids Res. 2021, doi: 10.1093/nar/gkab944 | Contact: Lukasz P. Kozlowski |
