Aequorivita sp. H23M31
Taxonomy: cellular organisms; Bacteria; FCB group; Bacteroidetes/Chlorobi group; Bacteroidetes; Flavobacteriia; Flavobacteriales; Flavobacteriaceae; Aequorivita; unclassified Aequorivita
Average proteome isoelectric point is 6.43
Get precalculated fractions of proteins

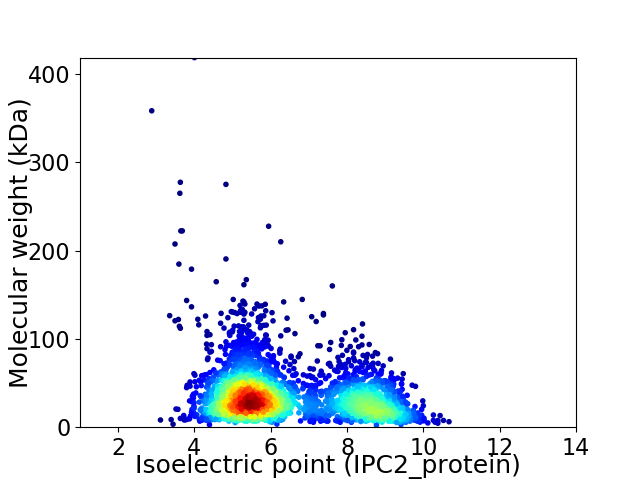
Virtual 2D-PAGE plot for 3051 proteins (isoelectric point calculated using IPC2_protein)
Get csv file with sequences according to given criteria:
* You can choose from 21 different methods for calculating isoelectric point
Summary statistics related to proteome-wise predictions


Protein with the lowest isoelectric point:
>tr|A0A410FZF5|A0A410FZF5_9FLAO Uncharacterized protein OS=Aequorivita sp. H23M31 OX=2494375 GN=EI546_01105 PE=4 SV=1
MM1 pKa = 7.46KK2 pKa = 10.32KK3 pKa = 8.41ITLIMFALATSFVFAQSATNAEE25 pKa = 4.7SILSQTSGAIGDD37 pKa = 4.09GGVACGDD44 pKa = 3.46QGAGTTGDD52 pKa = 3.27NLYY55 pKa = 10.48FRR57 pKa = 11.84SYY59 pKa = 10.6YY60 pKa = 10.57LYY62 pKa = 10.26DD63 pKa = 3.35YY64 pKa = 10.1GVRR67 pKa = 11.84GIVQATGLEE76 pKa = 4.53FFVSTATGSTALQVMVFDD94 pKa = 4.46MEE96 pKa = 4.38GFPGGFDD103 pKa = 3.45ATNMPVPLASASLTVTSAQVGTMVRR128 pKa = 11.84ADD130 pKa = 3.8FDD132 pKa = 3.89SPAIVDD138 pKa = 3.58EE139 pKa = 4.3DD140 pKa = 4.06TTLVALVYY148 pKa = 8.9EE149 pKa = 4.63TDD151 pKa = 3.29GQTAQFYY158 pKa = 10.35LGTAAAEE165 pKa = 4.14DD166 pKa = 4.15APSYY170 pKa = 9.79LASVACEE177 pKa = 3.84INNPVPVAVIGFPDD191 pKa = 3.69ARR193 pKa = 11.84HH194 pKa = 5.72VINVIVDD201 pKa = 3.52DD202 pKa = 4.36VVAVGDD208 pKa = 3.96NLAEE212 pKa = 4.17MVSIFPNPTSSVLNINLPSNIEE234 pKa = 4.11VLSSALVDD242 pKa = 3.36VLGRR246 pKa = 11.84TTGVVYY252 pKa = 10.95SNGQMDD258 pKa = 4.08VSGLSQGVYY267 pKa = 9.83FLKK270 pKa = 11.07LEE272 pKa = 4.26TTQGSLTQRR281 pKa = 11.84IVKK284 pKa = 9.23QQ285 pKa = 3.32
MM1 pKa = 7.46KK2 pKa = 10.32KK3 pKa = 8.41ITLIMFALATSFVFAQSATNAEE25 pKa = 4.7SILSQTSGAIGDD37 pKa = 4.09GGVACGDD44 pKa = 3.46QGAGTTGDD52 pKa = 3.27NLYY55 pKa = 10.48FRR57 pKa = 11.84SYY59 pKa = 10.6YY60 pKa = 10.57LYY62 pKa = 10.26DD63 pKa = 3.35YY64 pKa = 10.1GVRR67 pKa = 11.84GIVQATGLEE76 pKa = 4.53FFVSTATGSTALQVMVFDD94 pKa = 4.46MEE96 pKa = 4.38GFPGGFDD103 pKa = 3.45ATNMPVPLASASLTVTSAQVGTMVRR128 pKa = 11.84ADD130 pKa = 3.8FDD132 pKa = 3.89SPAIVDD138 pKa = 3.58EE139 pKa = 4.3DD140 pKa = 4.06TTLVALVYY148 pKa = 8.9EE149 pKa = 4.63TDD151 pKa = 3.29GQTAQFYY158 pKa = 10.35LGTAAAEE165 pKa = 4.14DD166 pKa = 4.15APSYY170 pKa = 9.79LASVACEE177 pKa = 3.84INNPVPVAVIGFPDD191 pKa = 3.69ARR193 pKa = 11.84HH194 pKa = 5.72VINVIVDD201 pKa = 3.52DD202 pKa = 4.36VVAVGDD208 pKa = 3.96NLAEE212 pKa = 4.17MVSIFPNPTSSVLNINLPSNIEE234 pKa = 4.11VLSSALVDD242 pKa = 3.36VLGRR246 pKa = 11.84TTGVVYY252 pKa = 10.95SNGQMDD258 pKa = 4.08VSGLSQGVYY267 pKa = 9.83FLKK270 pKa = 11.07LEE272 pKa = 4.26TTQGSLTQRR281 pKa = 11.84IVKK284 pKa = 9.23QQ285 pKa = 3.32
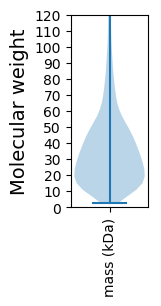
Molecular weight: 29.81 kDa
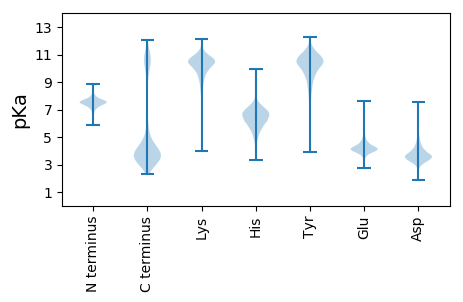
Isoelectric point according different methods:
Protein with the highest isoelectric point:
>tr|A0A410G096|A0A410G096_9FLAO DUF3095 domain-containing protein OS=Aequorivita sp. H23M31 OX=2494375 GN=EI546_02620 PE=4 SV=1
MM1 pKa = 7.48LLKK4 pKa = 10.16HH5 pKa = 6.8DD6 pKa = 4.58RR7 pKa = 11.84CTKK10 pKa = 8.57NNKK13 pKa = 9.27NFVHH17 pKa = 6.06YY18 pKa = 9.5FALSRR23 pKa = 11.84FVVSFCRR30 pKa = 11.84DD31 pKa = 3.08SLQSRR36 pKa = 11.84FVVLSSRR43 pKa = 11.84GAFPSCYY50 pKa = 9.87LPIVMPFNNQSPHH63 pKa = 5.21RR64 pKa = 4.27
MM1 pKa = 7.48LLKK4 pKa = 10.16HH5 pKa = 6.8DD6 pKa = 4.58RR7 pKa = 11.84CTKK10 pKa = 8.57NNKK13 pKa = 9.27NFVHH17 pKa = 6.06YY18 pKa = 9.5FALSRR23 pKa = 11.84FVVSFCRR30 pKa = 11.84DD31 pKa = 3.08SLQSRR36 pKa = 11.84FVVLSSRR43 pKa = 11.84GAFPSCYY50 pKa = 9.87LPIVMPFNNQSPHH63 pKa = 5.21RR64 pKa = 4.27
Molecular weight: 7.51 kDa
Isoelectric point according different methods:
Peptides (in silico digests for buttom-up proteomics)
Below you can find in silico digests of the whole proteome with Trypsin, Chymotrypsin, Trypsin+LysC, LysN, ArgC proteases suitable for different mass spec machines.| Try ESI |
 |
|---|
| ChTry ESI |
 |
|---|
| ArgC ESI |
 |
|---|
| LysN ESI |
 |
|---|
| TryLysC ESI |
 |
|---|
| Try MALDI |
 |
|---|
| ChTry MALDI |
 |
|---|
| ArgC MALDI |
 |
|---|
| LysN MALDI |
 |
|---|
| TryLysC MALDI |
 |
|---|
| Try LTQ |
 |
|---|
| ChTry LTQ |
 |
|---|
| ArgC LTQ |
 |
|---|
| LysN LTQ |
 |
|---|
| TryLysC LTQ |
 |
|---|
| Try MSlow |
 |
|---|
| ChTry MSlow |
 |
|---|
| ArgC MSlow |
 |
|---|
| LysN MSlow |
 |
|---|
| TryLysC MSlow |
 |
|---|
| Try MShigh |
 |
|---|
| ChTry MShigh |
 |
|---|
| ArgC MShigh |
 |
|---|
| LysN MShigh |
 |
|---|
| TryLysC MShigh |
 |
|---|
General Statistics
Number of major isoforms |
Number of additional isoforms |
Number of all proteins |
Number of amino acids |
Min. Seq. Length |
Max. Seq. Length |
Avg. Seq. Length |
Avg. Mol. Weight |
|---|---|---|---|---|---|---|---|
0 |
1022300 |
20 |
3897 |
335.1 |
37.85 |
Amino acid frequency
Ala |
Cys |
Asp |
Glu |
Phe |
Gly |
His |
Ile |
Lys |
Leu |
|---|---|---|---|---|---|---|---|---|---|
6.254 ± 0.043 | 0.726 ± 0.017 |
5.651 ± 0.04 | 6.926 ± 0.045 |
5.267 ± 0.036 | 6.561 ± 0.05 |
1.728 ± 0.02 | 7.885 ± 0.046 |
7.478 ± 0.072 | 9.29 ± 0.056 |
Met |
Asn |
Gln |
Pro |
Arg |
Ser |
Thr |
Val |
Trp |
Tyr |
|---|---|---|---|---|---|---|---|---|---|
2.324 ± 0.022 | 5.874 ± 0.044 |
3.623 ± 0.03 | 3.33 ± 0.024 |
3.82 ± 0.036 | 6.524 ± 0.038 |
5.54 ± 0.067 | 6.104 ± 0.033 |
1.039 ± 0.015 | 4.056 ± 0.03 |
Most of the basic statistics you can see at this page can be downloaded from this CSV file
Proteome-pI is available under Creative Commons Attribution-NoDerivs license, for more details see here
| Reference: Kozlowski LP. Proteome-pI 2.0: Proteome Isoelectric Point Database Update. Nucleic Acids Res. 2021, doi: 10.1093/nar/gkab944 | Contact: Lukasz P. Kozlowski |
