Sclerotinia sclerotiorum negative-stranded RNA virus 1
Taxonomy: Viruses; Riboviria; Orthornavirae; Negarnaviricota; Haploviricotina; Monjiviricetes; Mononegavirales; Mymonaviridae; Sclerotimonavirus; Sclerotimonavirus sclerotiniae
Average proteome isoelectric point is 6.26
Get precalculated fractions of proteins

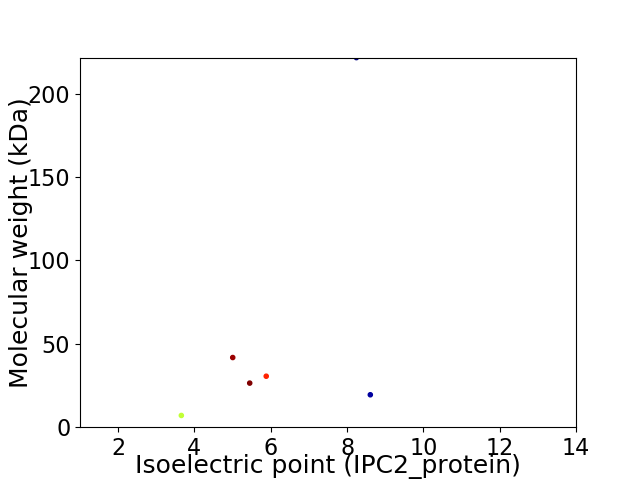
Virtual 2D-PAGE plot for 6 proteins (isoelectric point calculated using IPC2_protein)
Get csv file with sequences according to given criteria:
* You can choose from 21 different methods for calculating isoelectric point
Summary statistics related to proteome-wise predictions


Protein with the lowest isoelectric point:
>tr|X5ETK0|X5ETK0_9MONO Large structural protein OS=Sclerotinia sclerotiorum negative-stranded RNA virus 1 OX=1483724 PE=4 SV=1
MM1 pKa = 7.95DD2 pKa = 3.7VLEE5 pKa = 4.85NQPQFDD11 pKa = 4.55FYY13 pKa = 11.76SFVCALVLLEE23 pKa = 5.21DD24 pKa = 3.34LTKK27 pKa = 10.55RR28 pKa = 11.84VWEE31 pKa = 4.31SNLIEE36 pKa = 4.26TSSEE40 pKa = 3.8FSLVTEE46 pKa = 4.61DD47 pKa = 4.85GEE49 pKa = 4.37FEE51 pKa = 4.24EE52 pKa = 5.54VEE54 pKa = 4.42VTSGSNLGG62 pKa = 3.56
MM1 pKa = 7.95DD2 pKa = 3.7VLEE5 pKa = 4.85NQPQFDD11 pKa = 4.55FYY13 pKa = 11.76SFVCALVLLEE23 pKa = 5.21DD24 pKa = 3.34LTKK27 pKa = 10.55RR28 pKa = 11.84VWEE31 pKa = 4.31SNLIEE36 pKa = 4.26TSSEE40 pKa = 3.8FSLVTEE46 pKa = 4.61DD47 pKa = 4.85GEE49 pKa = 4.37FEE51 pKa = 4.24EE52 pKa = 5.54VEE54 pKa = 4.42VTSGSNLGG62 pKa = 3.56
Molecular weight: 7.04 kDa
Isoelectric point according different methods:
Protein with the highest isoelectric point:
>tr|X5FC24|X5FC24_9MONO Nucleoprotein OS=Sclerotinia sclerotiorum negative-stranded RNA virus 1 OX=1483724 PE=4 SV=1
MM1 pKa = 7.76PSYY4 pKa = 10.45KK5 pKa = 10.02EE6 pKa = 4.22KK7 pKa = 11.05YY8 pKa = 9.86FSICNRR14 pKa = 11.84LTTMEE19 pKa = 4.17RR20 pKa = 11.84RR21 pKa = 11.84VLLDD25 pKa = 3.21EE26 pKa = 6.17SILLDD31 pKa = 4.25LRR33 pKa = 11.84QTILNLQTQLNNPQKK48 pKa = 10.57EE49 pKa = 3.93LDD51 pKa = 3.59EE52 pKa = 4.33FLINQLHH59 pKa = 6.26LALTEE64 pKa = 4.49LIKK67 pKa = 10.86YY68 pKa = 8.67ANPQFQLPAHH78 pKa = 6.49FKK80 pKa = 10.18GKK82 pKa = 9.9EE83 pKa = 3.6INEE86 pKa = 4.01ILTITTEE93 pKa = 4.11MIFNAVSLLRR103 pKa = 11.84DD104 pKa = 3.48ATVRR108 pKa = 11.84AQTIISDD115 pKa = 3.97IPSKK119 pKa = 10.21PIKK122 pKa = 10.26DD123 pKa = 3.79NPPSRR128 pKa = 11.84NHH130 pKa = 6.94LIKK133 pKa = 10.85NRR135 pKa = 11.84TLNNEE140 pKa = 3.41SRR142 pKa = 11.84IILKK146 pKa = 10.67SSTTEE151 pKa = 3.87LSPEE155 pKa = 3.9PSRR158 pKa = 11.84NRR160 pKa = 11.84PRR162 pKa = 11.84SFTMSPP168 pKa = 3.01
MM1 pKa = 7.76PSYY4 pKa = 10.45KK5 pKa = 10.02EE6 pKa = 4.22KK7 pKa = 11.05YY8 pKa = 9.86FSICNRR14 pKa = 11.84LTTMEE19 pKa = 4.17RR20 pKa = 11.84RR21 pKa = 11.84VLLDD25 pKa = 3.21EE26 pKa = 6.17SILLDD31 pKa = 4.25LRR33 pKa = 11.84QTILNLQTQLNNPQKK48 pKa = 10.57EE49 pKa = 3.93LDD51 pKa = 3.59EE52 pKa = 4.33FLINQLHH59 pKa = 6.26LALTEE64 pKa = 4.49LIKK67 pKa = 10.86YY68 pKa = 8.67ANPQFQLPAHH78 pKa = 6.49FKK80 pKa = 10.18GKK82 pKa = 9.9EE83 pKa = 3.6INEE86 pKa = 4.01ILTITTEE93 pKa = 4.11MIFNAVSLLRR103 pKa = 11.84DD104 pKa = 3.48ATVRR108 pKa = 11.84AQTIISDD115 pKa = 3.97IPSKK119 pKa = 10.21PIKK122 pKa = 10.26DD123 pKa = 3.79NPPSRR128 pKa = 11.84NHH130 pKa = 6.94LIKK133 pKa = 10.85NRR135 pKa = 11.84TLNNEE140 pKa = 3.41SRR142 pKa = 11.84IILKK146 pKa = 10.67SSTTEE151 pKa = 3.87LSPEE155 pKa = 3.9PSRR158 pKa = 11.84NRR160 pKa = 11.84PRR162 pKa = 11.84SFTMSPP168 pKa = 3.01
Molecular weight: 19.44 kDa
Isoelectric point according different methods:
Peptides (in silico digests for buttom-up proteomics)
Below you can find in silico digests of the whole proteome with Trypsin, Chymotrypsin, Trypsin+LysC, LysN, ArgC proteases suitable for different mass spec machines.| Try ESI |
 |
|---|
| ChTry ESI |
 |
|---|
| ArgC ESI |
 |
|---|
| LysN ESI |
 |
|---|
| TryLysC ESI |
 |
|---|
| Try MALDI |
 |
|---|
| ChTry MALDI |
 |
|---|
| ArgC MALDI |
 |
|---|
| LysN MALDI |
 |
|---|
| TryLysC MALDI |
 |
|---|
| Try LTQ |
 |
|---|
| ChTry LTQ |
 |
|---|
| ArgC LTQ |
 |
|---|
| LysN LTQ |
 |
|---|
| TryLysC LTQ |
 |
|---|
| Try MSlow |
 |
|---|
| ChTry MSlow |
 |
|---|
| ArgC MSlow |
 |
|---|
| LysN MSlow |
 |
|---|
| TryLysC MSlow |
 |
|---|
| Try MShigh |
 |
|---|
| ChTry MShigh |
 |
|---|
| ArgC MShigh |
 |
|---|
| LysN MShigh |
 |
|---|
| TryLysC MShigh |
 |
|---|
General Statistics
Number of major isoforms |
Number of additional isoforms |
Number of all proteins |
Number of amino acids |
Min. Seq. Length |
Max. Seq. Length |
Avg. Seq. Length |
Avg. Mol. Weight |
|---|---|---|---|---|---|---|---|
0 |
3050 |
62 |
1934 |
508.3 |
57.79 |
Amino acid frequency
Ala |
Cys |
Asp |
Glu |
Phe |
Gly |
His |
Ile |
Lys |
Leu |
|---|---|---|---|---|---|---|---|---|---|
5.574 ± 1.265 | 1.377 ± 0.26 |
5.443 ± 0.338 | 6.033 ± 0.914 |
4.328 ± 0.698 | 4.066 ± 0.486 |
2.131 ± 0.283 | 7.443 ± 0.451 |
5.902 ± 0.572 | 10.885 ± 0.444 |
Met |
Asn |
Gln |
Pro |
Arg |
Ser |
Thr |
Val |
Trp |
Tyr |
|---|---|---|---|---|---|---|---|---|---|
2.197 ± 0.089 | 4.689 ± 0.617 |
5.049 ± 0.329 | 3.639 ± 0.457 |
5.705 ± 0.424 | 9.344 ± 0.128 |
6.721 ± 0.772 | 4.754 ± 0.588 |
1.082 ± 0.37 | 3.639 ± 0.698 |
Most of the basic statistics you can see at this page can be downloaded from this CSV file
Proteome-pI is available under Creative Commons Attribution-NoDerivs license, for more details see here
| Reference: Kozlowski LP. Proteome-pI 2.0: Proteome Isoelectric Point Database Update. Nucleic Acids Res. 2021, doi: 10.1093/nar/gkab944 | Contact: Lukasz P. Kozlowski |
