Corynebacterium sp. sy039
Taxonomy: cellular organisms; Bacteria; Terrabacteria group; Actinobacteria; Actinomycetia; Corynebacteriales; Corynebacteriaceae; Corynebacterium; unclassified Corynebacterium
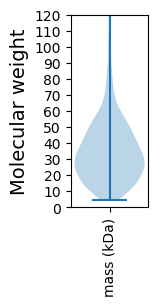
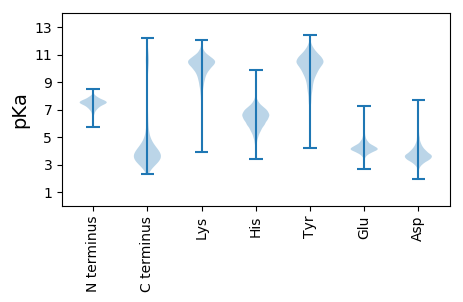
Average proteome isoelectric point is 6.17
Get precalculated fractions of proteins

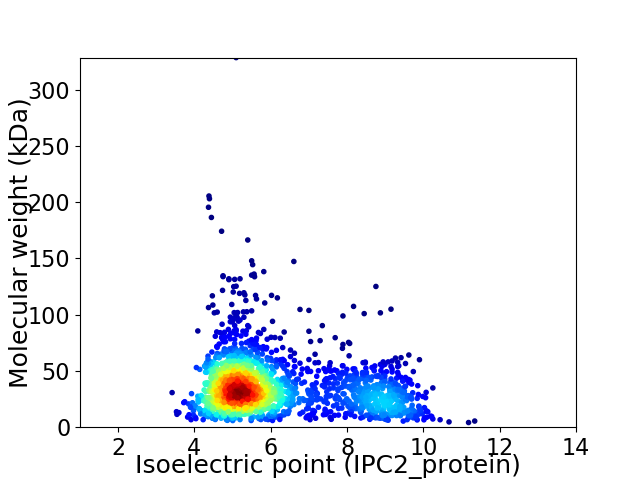
Virtual 2D-PAGE plot for 1918 proteins (isoelectric point calculated using IPC2_protein)
Get csv file with sequences according to given criteria:
* You can choose from 21 different methods for calculating isoelectric point
Summary statistics related to proteome-wise predictions


Protein with the lowest isoelectric point:
>tr|A0A5B8NS09|A0A5B8NS09_9CORY Pyridoxal phosphate-dependent aminotransferase OS=Corynebacterium sp. sy039 OX=2599641 GN=FQV43_00685 PE=4 SV=1
MM1 pKa = 7.86PAFQAEE7 pKa = 4.16VGMPYY12 pKa = 10.25WLDD15 pKa = 3.52LTSSDD20 pKa = 3.89SAQSVQFYY28 pKa = 10.98SEE30 pKa = 4.14LFGWEE35 pKa = 3.45ISEE38 pKa = 4.17YY39 pKa = 10.55SPGYY43 pKa = 9.81HH44 pKa = 5.78VARR47 pKa = 11.84IQGLPVAGIVQRR59 pKa = 11.84DD60 pKa = 3.86KK61 pKa = 11.77NSAQPDD67 pKa = 3.17TWITYY72 pKa = 8.39FLSGDD77 pKa = 3.87IDD79 pKa = 4.05TQCQQIAQLGGRR91 pKa = 11.84VLAPAAEE98 pKa = 4.17VRR100 pKa = 11.84LGRR103 pKa = 11.84MAIVVDD109 pKa = 3.53NAGAAFGLIEE119 pKa = 4.82PGGEE123 pKa = 4.03DD124 pKa = 3.17SFIAAGEE131 pKa = 4.02PGTPVWHH138 pKa = 6.77EE139 pKa = 3.72LSCVNDD145 pKa = 3.55YY146 pKa = 11.3AQATQFYY153 pKa = 10.03ADD155 pKa = 3.58LFEE158 pKa = 4.53WLMSEE163 pKa = 4.23QRR165 pKa = 11.84NEE167 pKa = 3.89YY168 pKa = 10.62GSYY171 pKa = 7.51TTALVDD177 pKa = 3.85GAAFAGILDD186 pKa = 3.86AHH188 pKa = 6.13QLFAAHH194 pKa = 6.62VPNFWQSYY202 pKa = 9.51LGVADD207 pKa = 3.16VDD209 pKa = 3.91AAVVRR214 pKa = 11.84VPEE217 pKa = 4.42LGGDD221 pKa = 4.3IIRR224 pKa = 11.84EE225 pKa = 4.08PWDD228 pKa = 3.32SAFGRR233 pKa = 11.84MAIIADD239 pKa = 3.6ATGATLTICEE249 pKa = 4.13VAEE252 pKa = 4.04PVAEE256 pKa = 4.17GRR258 pKa = 11.84EE259 pKa = 4.15SDD261 pKa = 3.8PLQDD265 pKa = 3.78IDD267 pKa = 4.29LSNYY271 pKa = 10.0PEE273 pKa = 4.39FGG275 pKa = 3.28
MM1 pKa = 7.86PAFQAEE7 pKa = 4.16VGMPYY12 pKa = 10.25WLDD15 pKa = 3.52LTSSDD20 pKa = 3.89SAQSVQFYY28 pKa = 10.98SEE30 pKa = 4.14LFGWEE35 pKa = 3.45ISEE38 pKa = 4.17YY39 pKa = 10.55SPGYY43 pKa = 9.81HH44 pKa = 5.78VARR47 pKa = 11.84IQGLPVAGIVQRR59 pKa = 11.84DD60 pKa = 3.86KK61 pKa = 11.77NSAQPDD67 pKa = 3.17TWITYY72 pKa = 8.39FLSGDD77 pKa = 3.87IDD79 pKa = 4.05TQCQQIAQLGGRR91 pKa = 11.84VLAPAAEE98 pKa = 4.17VRR100 pKa = 11.84LGRR103 pKa = 11.84MAIVVDD109 pKa = 3.53NAGAAFGLIEE119 pKa = 4.82PGGEE123 pKa = 4.03DD124 pKa = 3.17SFIAAGEE131 pKa = 4.02PGTPVWHH138 pKa = 6.77EE139 pKa = 3.72LSCVNDD145 pKa = 3.55YY146 pKa = 11.3AQATQFYY153 pKa = 10.03ADD155 pKa = 3.58LFEE158 pKa = 4.53WLMSEE163 pKa = 4.23QRR165 pKa = 11.84NEE167 pKa = 3.89YY168 pKa = 10.62GSYY171 pKa = 7.51TTALVDD177 pKa = 3.85GAAFAGILDD186 pKa = 3.86AHH188 pKa = 6.13QLFAAHH194 pKa = 6.62VPNFWQSYY202 pKa = 9.51LGVADD207 pKa = 3.16VDD209 pKa = 3.91AAVVRR214 pKa = 11.84VPEE217 pKa = 4.42LGGDD221 pKa = 4.3IIRR224 pKa = 11.84EE225 pKa = 4.08PWDD228 pKa = 3.32SAFGRR233 pKa = 11.84MAIIADD239 pKa = 3.6ATGATLTICEE249 pKa = 4.13VAEE252 pKa = 4.04PVAEE256 pKa = 4.17GRR258 pKa = 11.84EE259 pKa = 4.15SDD261 pKa = 3.8PLQDD265 pKa = 3.78IDD267 pKa = 4.29LSNYY271 pKa = 10.0PEE273 pKa = 4.39FGG275 pKa = 3.28
Molecular weight: 29.81 kDa
Isoelectric point according different methods:
Protein with the highest isoelectric point:
>tr|A0A5B8NWH0|A0A5B8NWH0_9CORY Asparaginase OS=Corynebacterium sp. sy039 OX=2599641 GN=FQV43_06825 PE=3 SV=1
MM1 pKa = 7.46TKK3 pKa = 10.27GKK5 pKa = 8.73RR6 pKa = 11.84TFQPNNRR13 pKa = 11.84RR14 pKa = 11.84RR15 pKa = 11.84ARR17 pKa = 11.84KK18 pKa = 8.59HH19 pKa = 4.59GFRR22 pKa = 11.84TRR24 pKa = 11.84MATRR28 pKa = 11.84AGRR31 pKa = 11.84AIVAARR37 pKa = 11.84RR38 pKa = 11.84RR39 pKa = 11.84KK40 pKa = 9.3GRR42 pKa = 11.84ARR44 pKa = 11.84VTAA47 pKa = 4.09
MM1 pKa = 7.46TKK3 pKa = 10.27GKK5 pKa = 8.73RR6 pKa = 11.84TFQPNNRR13 pKa = 11.84RR14 pKa = 11.84RR15 pKa = 11.84ARR17 pKa = 11.84KK18 pKa = 8.59HH19 pKa = 4.59GFRR22 pKa = 11.84TRR24 pKa = 11.84MATRR28 pKa = 11.84AGRR31 pKa = 11.84AIVAARR37 pKa = 11.84RR38 pKa = 11.84RR39 pKa = 11.84KK40 pKa = 9.3GRR42 pKa = 11.84ARR44 pKa = 11.84VTAA47 pKa = 4.09
Molecular weight: 5.48 kDa
Isoelectric point according different methods:
Peptides (in silico digests for buttom-up proteomics)
Below you can find in silico digests of the whole proteome with Trypsin, Chymotrypsin, Trypsin+LysC, LysN, ArgC proteases suitable for different mass spec machines.| Try ESI |
 |
|---|
| ChTry ESI |
 |
|---|
| ArgC ESI |
 |
|---|
| LysN ESI |
 |
|---|
| TryLysC ESI |
 |
|---|
| Try MALDI |
 |
|---|
| ChTry MALDI |
 |
|---|
| ArgC MALDI |
 |
|---|
| LysN MALDI |
 |
|---|
| TryLysC MALDI |
 |
|---|
| Try LTQ |
 |
|---|
| ChTry LTQ |
 |
|---|
| ArgC LTQ |
 |
|---|
| LysN LTQ |
 |
|---|
| TryLysC LTQ |
 |
|---|
| Try MSlow |
 |
|---|
| ChTry MSlow |
 |
|---|
| ArgC MSlow |
 |
|---|
| LysN MSlow |
 |
|---|
| TryLysC MSlow |
 |
|---|
| Try MShigh |
 |
|---|
| ChTry MShigh |
 |
|---|
| ArgC MShigh |
 |
|---|
| LysN MShigh |
 |
|---|
| TryLysC MShigh |
 |
|---|
General Statistics
Number of major isoforms |
Number of additional isoforms |
Number of all proteins |
Number of amino acids |
Min. Seq. Length |
Max. Seq. Length |
Avg. Seq. Length |
Avg. Mol. Weight |
|---|---|---|---|---|---|---|---|
0 |
653807 |
33 |
3042 |
340.9 |
37.17 |
Amino acid frequency
Ala |
Cys |
Asp |
Glu |
Phe |
Gly |
His |
Ile |
Lys |
Leu |
|---|---|---|---|---|---|---|---|---|---|
10.899 ± 0.058 | 0.9 ± 0.017 |
5.513 ± 0.049 | 6.029 ± 0.06 |
3.468 ± 0.04 | 7.558 ± 0.045 |
2.506 ± 0.029 | 6.241 ± 0.048 |
3.882 ± 0.045 | 9.629 ± 0.065 |
Met |
Asn |
Gln |
Pro |
Arg |
Ser |
Thr |
Val |
Trp |
Tyr |
|---|---|---|---|---|---|---|---|---|---|
2.167 ± 0.026 | 3.144 ± 0.03 |
4.653 ± 0.039 | 4.171 ± 0.042 |
5.393 ± 0.055 | 6.501 ± 0.043 |
5.972 ± 0.043 | 7.614 ± 0.051 |
1.264 ± 0.022 | 2.496 ± 0.027 |
Most of the basic statistics you can see at this page can be downloaded from this CSV file
Proteome-pI is available under Creative Commons Attribution-NoDerivs license, for more details see here
| Reference: Kozlowski LP. Proteome-pI 2.0: Proteome Isoelectric Point Database Update. Nucleic Acids Res. 2021, doi: 10.1093/nar/gkab944 | Contact: Lukasz P. Kozlowski |
