Tsuneonella aeria
Taxonomy: cellular organisms; Bacteria; Proteobacteria; Alphaproteobacteria; Sphingomonadales; Erythrobacteraceae; Tsuneonella
Average proteome isoelectric point is 6.37
Get precalculated fractions of proteins

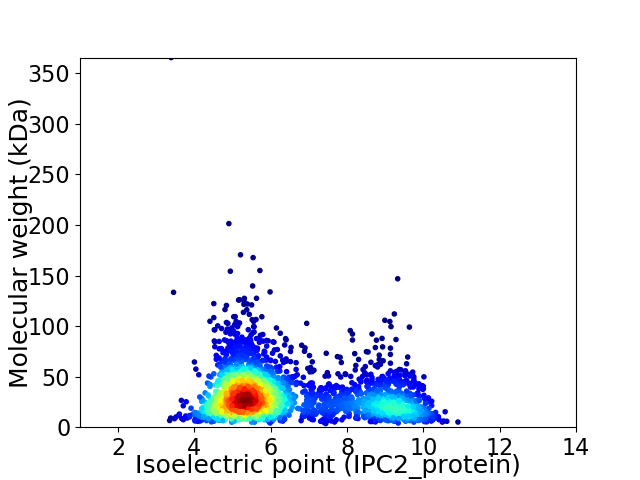
Virtual 2D-PAGE plot for 2648 proteins (isoelectric point calculated using IPC2_protein)
Get csv file with sequences according to given criteria:
* You can choose from 21 different methods for calculating isoelectric point
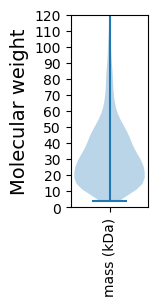
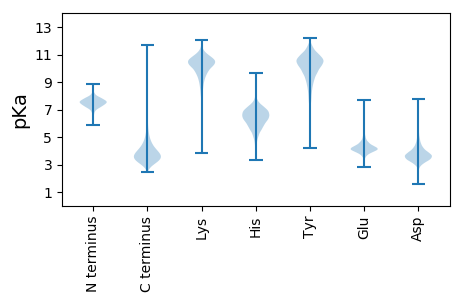
Summary statistics related to proteome-wise predictions


Protein with the lowest isoelectric point:
>tr|A0A6I4TC93|A0A6I4TC93_9SPHN LPS export ABC transporter permease LptG OS=Tsuneonella aeria OX=1837929 GN=lptG PE=4 SV=1
MM1 pKa = 7.2FLSTRR6 pKa = 11.84GIVGALLAASAMAATPAFAQDD27 pKa = 3.55ASPGLGAFTVSGSATAVTDD46 pKa = 3.31YY47 pKa = 10.88RR48 pKa = 11.84FRR50 pKa = 11.84GVSRR54 pKa = 11.84SGGDD58 pKa = 3.29PAIQGGVTVAHH69 pKa = 7.28DD70 pKa = 3.42SGFYY74 pKa = 10.27AGTWASSIDD83 pKa = 4.02DD84 pKa = 4.76GGTDD88 pKa = 3.54LYY90 pKa = 11.49GDD92 pKa = 3.82VEE94 pKa = 4.92LDD96 pKa = 3.95VFGGWSGGVAEE107 pKa = 5.08GVGIDD112 pKa = 4.27VGLLYY117 pKa = 10.98YY118 pKa = 10.43AFPTNGPGVDD128 pKa = 3.07AGFFEE133 pKa = 5.5PYY135 pKa = 9.5ATVTGDD141 pKa = 4.62LGPLSARR148 pKa = 11.84AGVNYY153 pKa = 10.21AWSQDD158 pKa = 3.38ALGGGDD164 pKa = 3.47NLYY167 pKa = 10.13IHH169 pKa = 7.04TEE171 pKa = 3.96LSSGIPTTPLTVTARR186 pKa = 11.84LGYY189 pKa = 9.15TDD191 pKa = 5.39GPLAPPLLAGTGDD204 pKa = 3.22RR205 pKa = 11.84TGFDD209 pKa = 2.95WSLGAKK215 pKa = 8.68ATVLGGLTLGAAYY228 pKa = 10.12VGSEE232 pKa = 4.34GPGIDD237 pKa = 4.19GFTDD241 pKa = 3.34DD242 pKa = 4.23TVVFSLGASFF252 pKa = 5.21
MM1 pKa = 7.2FLSTRR6 pKa = 11.84GIVGALLAASAMAATPAFAQDD27 pKa = 3.55ASPGLGAFTVSGSATAVTDD46 pKa = 3.31YY47 pKa = 10.88RR48 pKa = 11.84FRR50 pKa = 11.84GVSRR54 pKa = 11.84SGGDD58 pKa = 3.29PAIQGGVTVAHH69 pKa = 7.28DD70 pKa = 3.42SGFYY74 pKa = 10.27AGTWASSIDD83 pKa = 4.02DD84 pKa = 4.76GGTDD88 pKa = 3.54LYY90 pKa = 11.49GDD92 pKa = 3.82VEE94 pKa = 4.92LDD96 pKa = 3.95VFGGWSGGVAEE107 pKa = 5.08GVGIDD112 pKa = 4.27VGLLYY117 pKa = 10.98YY118 pKa = 10.43AFPTNGPGVDD128 pKa = 3.07AGFFEE133 pKa = 5.5PYY135 pKa = 9.5ATVTGDD141 pKa = 4.62LGPLSARR148 pKa = 11.84AGVNYY153 pKa = 10.21AWSQDD158 pKa = 3.38ALGGGDD164 pKa = 3.47NLYY167 pKa = 10.13IHH169 pKa = 7.04TEE171 pKa = 3.96LSSGIPTTPLTVTARR186 pKa = 11.84LGYY189 pKa = 9.15TDD191 pKa = 5.39GPLAPPLLAGTGDD204 pKa = 3.22RR205 pKa = 11.84TGFDD209 pKa = 2.95WSLGAKK215 pKa = 8.68ATVLGGLTLGAAYY228 pKa = 10.12VGSEE232 pKa = 4.34GPGIDD237 pKa = 4.19GFTDD241 pKa = 3.34DD242 pKa = 4.23TVVFSLGASFF252 pKa = 5.21
Molecular weight: 25.16 kDa
Isoelectric point according different methods:
Protein with the highest isoelectric point:
>tr|A0A6I4TDF2|A0A6I4TDF2_9SPHN DNA-directed RNA polymerase subunit beta OS=Tsuneonella aeria OX=1837929 GN=rpoB PE=3 SV=1
MM1 pKa = 7.45KK2 pKa = 9.61RR3 pKa = 11.84TFQPSNLVRR12 pKa = 11.84ARR14 pKa = 11.84RR15 pKa = 11.84HH16 pKa = 4.89GFFARR21 pKa = 11.84KK22 pKa = 7.42ATPGGRR28 pKa = 11.84KK29 pKa = 8.0VLRR32 pKa = 11.84ARR34 pKa = 11.84RR35 pKa = 11.84ARR37 pKa = 11.84GRR39 pKa = 11.84KK40 pKa = 8.81KK41 pKa = 10.46LCAA44 pKa = 3.96
MM1 pKa = 7.45KK2 pKa = 9.61RR3 pKa = 11.84TFQPSNLVRR12 pKa = 11.84ARR14 pKa = 11.84RR15 pKa = 11.84HH16 pKa = 4.89GFFARR21 pKa = 11.84KK22 pKa = 7.42ATPGGRR28 pKa = 11.84KK29 pKa = 8.0VLRR32 pKa = 11.84ARR34 pKa = 11.84RR35 pKa = 11.84ARR37 pKa = 11.84GRR39 pKa = 11.84KK40 pKa = 8.81KK41 pKa = 10.46LCAA44 pKa = 3.96
Molecular weight: 5.11 kDa
Isoelectric point according different methods:
Peptides (in silico digests for buttom-up proteomics)
Below you can find in silico digests of the whole proteome with Trypsin, Chymotrypsin, Trypsin+LysC, LysN, ArgC proteases suitable for different mass spec machines.| Try ESI |
 |
|---|
| ChTry ESI |
 |
|---|
| ArgC ESI |
 |
|---|
| LysN ESI |
 |
|---|
| TryLysC ESI |
 |
|---|
| Try MALDI |
 |
|---|
| ChTry MALDI |
 |
|---|
| ArgC MALDI |
 |
|---|
| LysN MALDI |
 |
|---|
| TryLysC MALDI |
 |
|---|
| Try LTQ |
 |
|---|
| ChTry LTQ |
 |
|---|
| ArgC LTQ |
 |
|---|
| LysN LTQ |
 |
|---|
| TryLysC LTQ |
 |
|---|
| Try MSlow |
 |
|---|
| ChTry MSlow |
 |
|---|
| ArgC MSlow |
 |
|---|
| LysN MSlow |
 |
|---|
| TryLysC MSlow |
 |
|---|
| Try MShigh |
 |
|---|
| ChTry MShigh |
 |
|---|
| ArgC MShigh |
 |
|---|
| LysN MShigh |
 |
|---|
| TryLysC MShigh |
 |
|---|
General Statistics
Number of major isoforms |
Number of additional isoforms |
Number of all proteins |
Number of amino acids |
Min. Seq. Length |
Max. Seq. Length |
Avg. Seq. Length |
Avg. Mol. Weight |
|---|---|---|---|---|---|---|---|
0 |
832301 |
33 |
3692 |
314.3 |
33.86 |
Amino acid frequency
Ala |
Cys |
Asp |
Glu |
Phe |
Gly |
His |
Ile |
Lys |
Leu |
|---|---|---|---|---|---|---|---|---|---|
13.951 ± 0.076 | 0.801 ± 0.015 |
6.052 ± 0.04 | 5.684 ± 0.047 |
3.477 ± 0.035 | 9.073 ± 0.043 |
1.961 ± 0.025 | 4.727 ± 0.026 |
2.659 ± 0.035 | 9.707 ± 0.046 |
Met |
Asn |
Gln |
Pro |
Arg |
Ser |
Thr |
Val |
Trp |
Tyr |
|---|---|---|---|---|---|---|---|---|---|
2.452 ± 0.024 | 2.386 ± 0.03 |
5.438 ± 0.029 | 3.006 ± 0.024 |
7.647 ± 0.052 | 4.986 ± 0.033 |
5.165 ± 0.047 | 7.305 ± 0.031 |
1.433 ± 0.021 | 2.091 ± 0.023 |
Most of the basic statistics you can see at this page can be downloaded from this CSV file
Proteome-pI is available under Creative Commons Attribution-NoDerivs license, for more details see here
| Reference: Kozlowski LP. Proteome-pI 2.0: Proteome Isoelectric Point Database Update. Nucleic Acids Res. 2021, doi: 10.1093/nar/gkab944 | Contact: Lukasz P. Kozlowski |
