Mangrovibacterium marinum
Taxonomy: cellular organisms; Bacteria; FCB group; Bacteroidetes/Chlorobi group; Bacteroidetes; Bacteroidia; Marinilabiliales; Prolixibacteraceae; Mangrovibacterium
Average proteome isoelectric point is 6.31
Get precalculated fractions of proteins

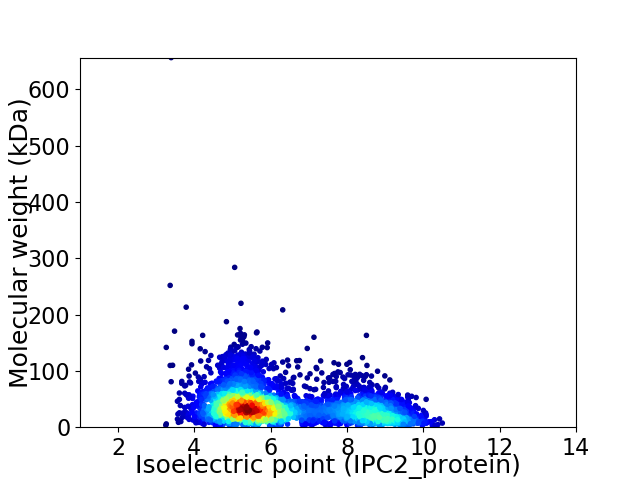
Virtual 2D-PAGE plot for 3633 proteins (isoelectric point calculated using IPC2_protein)
Get csv file with sequences according to given criteria:
* You can choose from 21 different methods for calculating isoelectric point
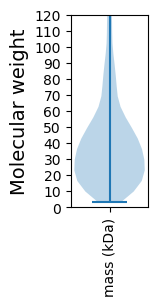
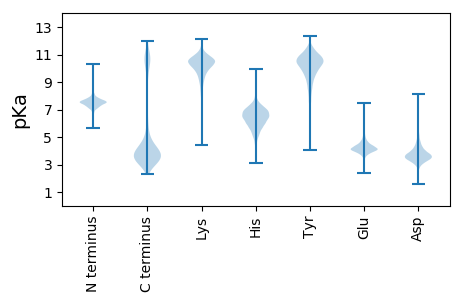
Summary statistics related to proteome-wise predictions


Protein with the lowest isoelectric point:
>tr|A0A2T5C0B1|A0A2T5C0B1_9BACT tRNA uridine(34) hydroxylase OS=Mangrovibacterium marinum OX=1639118 GN=trhO PE=3 SV=1
MM1 pKa = 7.03KK2 pKa = 9.71TIHH5 pKa = 7.24KK6 pKa = 10.12LFLLLAVVAFGACEE20 pKa = 4.13GPMGPPGYY28 pKa = 10.22DD29 pKa = 3.2GLDD32 pKa = 3.71GQDD35 pKa = 3.56GQDD38 pKa = 3.26GVNILGTVFEE48 pKa = 4.66VNGDD52 pKa = 3.54FTEE55 pKa = 4.23NNQYY59 pKa = 8.53TLYY62 pKa = 11.04YY63 pKa = 9.21PFPDD67 pKa = 4.31DD68 pKa = 3.64FQVYY72 pKa = 10.05NGDD75 pKa = 3.51AVVVYY80 pKa = 9.55ILWKK84 pKa = 10.66VVDD87 pKa = 5.05GLDD90 pKa = 3.08VWRR93 pKa = 11.84ALPQTIFLEE102 pKa = 4.7SGAFQYY108 pKa = 11.26NFDD111 pKa = 3.96YY112 pKa = 8.29TTGDD116 pKa = 3.19VQIFIDD122 pKa = 5.13GEE124 pKa = 4.31LDD126 pKa = 3.8PAWLGSGDD134 pKa = 5.2LVDD137 pKa = 3.38QTFRR141 pKa = 11.84IAVIPADD148 pKa = 4.01LYY150 pKa = 10.68SNKK153 pKa = 10.61SIDD156 pKa = 3.11ITNYY160 pKa = 10.8DD161 pKa = 3.64EE162 pKa = 4.45VNRR165 pKa = 11.84AMLLWGGKK173 pKa = 8.13INRR176 pKa = 11.84ATLVNSDD183 pKa = 3.67LL184 pKa = 4.05
MM1 pKa = 7.03KK2 pKa = 9.71TIHH5 pKa = 7.24KK6 pKa = 10.12LFLLLAVVAFGACEE20 pKa = 4.13GPMGPPGYY28 pKa = 10.22DD29 pKa = 3.2GLDD32 pKa = 3.71GQDD35 pKa = 3.56GQDD38 pKa = 3.26GVNILGTVFEE48 pKa = 4.66VNGDD52 pKa = 3.54FTEE55 pKa = 4.23NNQYY59 pKa = 8.53TLYY62 pKa = 11.04YY63 pKa = 9.21PFPDD67 pKa = 4.31DD68 pKa = 3.64FQVYY72 pKa = 10.05NGDD75 pKa = 3.51AVVVYY80 pKa = 9.55ILWKK84 pKa = 10.66VVDD87 pKa = 5.05GLDD90 pKa = 3.08VWRR93 pKa = 11.84ALPQTIFLEE102 pKa = 4.7SGAFQYY108 pKa = 11.26NFDD111 pKa = 3.96YY112 pKa = 8.29TTGDD116 pKa = 3.19VQIFIDD122 pKa = 5.13GEE124 pKa = 4.31LDD126 pKa = 3.8PAWLGSGDD134 pKa = 5.2LVDD137 pKa = 3.38QTFRR141 pKa = 11.84IAVIPADD148 pKa = 4.01LYY150 pKa = 10.68SNKK153 pKa = 10.61SIDD156 pKa = 3.11ITNYY160 pKa = 10.8DD161 pKa = 3.64EE162 pKa = 4.45VNRR165 pKa = 11.84AMLLWGGKK173 pKa = 8.13INRR176 pKa = 11.84ATLVNSDD183 pKa = 3.67LL184 pKa = 4.05
Molecular weight: 20.44 kDa
Isoelectric point according different methods:
Protein with the highest isoelectric point:
>tr|A0A2T5C0Y8|A0A2T5C0Y8_9BACT Gliding motility-associated protein GldM OS=Mangrovibacterium marinum OX=1639118 GN=C8N47_10913 PE=4 SV=1
MM1 pKa = 6.9TRR3 pKa = 11.84IVRR6 pKa = 11.84LTTNYY11 pKa = 9.88SRR13 pKa = 11.84SRR15 pKa = 11.84SHH17 pKa = 6.69SVQSSPFGEE26 pKa = 4.3LEE28 pKa = 4.03GGFPSHH34 pKa = 6.79PRR36 pKa = 11.84DD37 pKa = 3.4VGKK40 pKa = 8.64CTKK43 pKa = 10.05AANFEE48 pKa = 4.19FPITNIQYY56 pKa = 10.54RR57 pKa = 11.84MRR59 pKa = 11.84NRR61 pKa = 11.84EE62 pKa = 3.72TTLPQTPKK70 pKa = 10.78GAA72 pKa = 3.69
MM1 pKa = 6.9TRR3 pKa = 11.84IVRR6 pKa = 11.84LTTNYY11 pKa = 9.88SRR13 pKa = 11.84SRR15 pKa = 11.84SHH17 pKa = 6.69SVQSSPFGEE26 pKa = 4.3LEE28 pKa = 4.03GGFPSHH34 pKa = 6.79PRR36 pKa = 11.84DD37 pKa = 3.4VGKK40 pKa = 8.64CTKK43 pKa = 10.05AANFEE48 pKa = 4.19FPITNIQYY56 pKa = 10.54RR57 pKa = 11.84MRR59 pKa = 11.84NRR61 pKa = 11.84EE62 pKa = 3.72TTLPQTPKK70 pKa = 10.78GAA72 pKa = 3.69
Molecular weight: 8.16 kDa
Isoelectric point according different methods:
Peptides (in silico digests for buttom-up proteomics)
Below you can find in silico digests of the whole proteome with Trypsin, Chymotrypsin, Trypsin+LysC, LysN, ArgC proteases suitable for different mass spec machines.| Try ESI |
 |
|---|
| ChTry ESI |
 |
|---|
| ArgC ESI |
 |
|---|
| LysN ESI |
 |
|---|
| TryLysC ESI |
 |
|---|
| Try MALDI |
 |
|---|
| ChTry MALDI |
 |
|---|
| ArgC MALDI |
 |
|---|
| LysN MALDI |
 |
|---|
| TryLysC MALDI |
 |
|---|
| Try LTQ |
 |
|---|
| ChTry LTQ |
 |
|---|
| ArgC LTQ |
 |
|---|
| LysN LTQ |
 |
|---|
| TryLysC LTQ |
 |
|---|
| Try MSlow |
 |
|---|
| ChTry MSlow |
 |
|---|
| ArgC MSlow |
 |
|---|
| LysN MSlow |
 |
|---|
| TryLysC MSlow |
 |
|---|
| Try MShigh |
 |
|---|
| ChTry MShigh |
 |
|---|
| ArgC MShigh |
 |
|---|
| LysN MShigh |
 |
|---|
| TryLysC MShigh |
 |
|---|
General Statistics
Number of major isoforms |
Number of additional isoforms |
Number of all proteins |
Number of amino acids |
Min. Seq. Length |
Max. Seq. Length |
Avg. Seq. Length |
Avg. Mol. Weight |
|---|---|---|---|---|---|---|---|
0 |
1323685 |
27 |
6431 |
364.4 |
40.95 |
Amino acid frequency
Ala |
Cys |
Asp |
Glu |
Phe |
Gly |
His |
Ile |
Lys |
Leu |
|---|---|---|---|---|---|---|---|---|---|
7.52 ± 0.041 | 0.942 ± 0.017 |
5.757 ± 0.032 | 6.488 ± 0.04 |
4.832 ± 0.032 | 6.884 ± 0.038 |
1.845 ± 0.018 | 6.681 ± 0.036 |
6.301 ± 0.049 | 9.526 ± 0.055 |
Met |
Asn |
Gln |
Pro |
Arg |
Ser |
Thr |
Val |
Trp |
Tyr |
|---|---|---|---|---|---|---|---|---|---|
2.416 ± 0.024 | 5.073 ± 0.033 |
3.857 ± 0.024 | 4.036 ± 0.033 |
4.33 ± 0.031 | 6.297 ± 0.037 |
5.358 ± 0.066 | 6.49 ± 0.035 |
1.293 ± 0.017 | 4.077 ± 0.029 |
Most of the basic statistics you can see at this page can be downloaded from this CSV file
Proteome-pI is available under Creative Commons Attribution-NoDerivs license, for more details see here
| Reference: Kozlowski LP. Proteome-pI 2.0: Proteome Isoelectric Point Database Update. Nucleic Acids Res. 2021, doi: 10.1093/nar/gkab944 | Contact: Lukasz P. Kozlowski |
