Tyzzerella sp. An114
Taxonomy: cellular organisms; Bacteria; Terrabacteria group; Firmicutes; Clostridia; Eubacteriales; Lachnospiraceae; Tyzzerella; unclassified Tyzzerella
Average proteome isoelectric point is 6.12
Get precalculated fractions of proteins

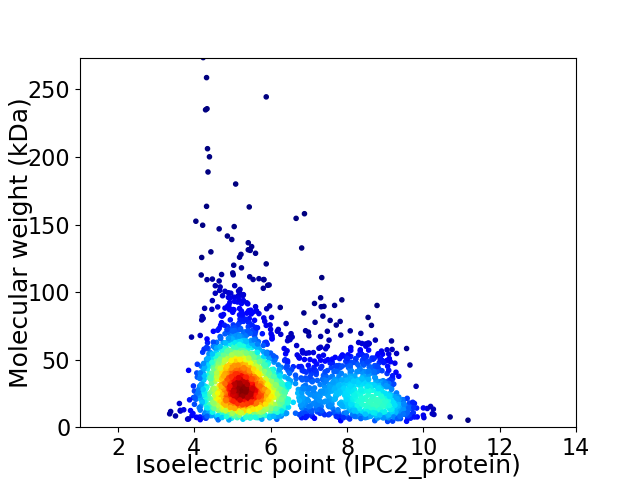
Virtual 2D-PAGE plot for 2549 proteins (isoelectric point calculated using IPC2_protein)
Get csv file with sequences according to given criteria:
* You can choose from 21 different methods for calculating isoelectric point
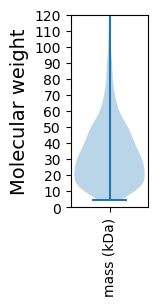
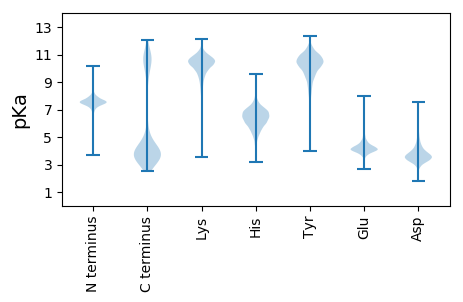
Summary statistics related to proteome-wise predictions


Protein with the lowest isoelectric point:
>tr|A0A1Y4UR18|A0A1Y4UR18_9FIRM PadR family transcriptional regulator OS=Tyzzerella sp. An114 OX=1965545 GN=B5E58_00040 PE=4 SV=1
MM1 pKa = 7.49KK2 pKa = 10.4KK3 pKa = 10.41SILLLSIMFLVMLSGCNTNTDD24 pKa = 3.22NTDD27 pKa = 3.25EE28 pKa = 4.24VEE30 pKa = 4.27KK31 pKa = 10.86NQEE34 pKa = 3.71NTTDD38 pKa = 3.19ISEE41 pKa = 4.68EE42 pKa = 3.53IAGYY46 pKa = 10.38IFIDD50 pKa = 3.75GDD52 pKa = 3.59KK53 pKa = 10.8LYY55 pKa = 10.87VDD57 pKa = 3.65EE58 pKa = 5.62VEE60 pKa = 5.27IIEE63 pKa = 4.61NSDD66 pKa = 3.54KK67 pKa = 11.23EE68 pKa = 4.27RR69 pKa = 11.84MEE71 pKa = 4.12EE72 pKa = 4.51LNINDD77 pKa = 3.48SDD79 pKa = 4.11FPNGYY84 pKa = 10.04YY85 pKa = 9.86IYY87 pKa = 10.64NPTFEE92 pKa = 4.94ADD94 pKa = 3.31EE95 pKa = 4.19YY96 pKa = 11.41KK97 pKa = 9.54ITDD100 pKa = 3.24DD101 pKa = 3.32TAYY104 pKa = 10.95DD105 pKa = 3.66FVDD108 pKa = 4.21FNLYY112 pKa = 10.72YY113 pKa = 9.8IDD115 pKa = 4.38EE116 pKa = 4.55NEE118 pKa = 3.82ADD120 pKa = 3.22GDD122 pKa = 3.57RR123 pKa = 11.84RR124 pKa = 11.84YY125 pKa = 9.23RR126 pKa = 11.84TNNIDD131 pKa = 3.54EE132 pKa = 5.07FIKK135 pKa = 10.41GSSYY139 pKa = 10.88RR140 pKa = 11.84EE141 pKa = 3.95EE142 pKa = 4.9LPLEE146 pKa = 4.19QQTIPYY152 pKa = 9.41IIEE155 pKa = 3.77LHH157 pKa = 6.54GEE159 pKa = 3.74DD160 pKa = 4.21VYY162 pKa = 11.27CIKK165 pKa = 10.93EE166 pKa = 4.01EE167 pKa = 4.37LLYY170 pKa = 9.92TQQ172 pKa = 4.65
MM1 pKa = 7.49KK2 pKa = 10.4KK3 pKa = 10.41SILLLSIMFLVMLSGCNTNTDD24 pKa = 3.22NTDD27 pKa = 3.25EE28 pKa = 4.24VEE30 pKa = 4.27KK31 pKa = 10.86NQEE34 pKa = 3.71NTTDD38 pKa = 3.19ISEE41 pKa = 4.68EE42 pKa = 3.53IAGYY46 pKa = 10.38IFIDD50 pKa = 3.75GDD52 pKa = 3.59KK53 pKa = 10.8LYY55 pKa = 10.87VDD57 pKa = 3.65EE58 pKa = 5.62VEE60 pKa = 5.27IIEE63 pKa = 4.61NSDD66 pKa = 3.54KK67 pKa = 11.23EE68 pKa = 4.27RR69 pKa = 11.84MEE71 pKa = 4.12EE72 pKa = 4.51LNINDD77 pKa = 3.48SDD79 pKa = 4.11FPNGYY84 pKa = 10.04YY85 pKa = 9.86IYY87 pKa = 10.64NPTFEE92 pKa = 4.94ADD94 pKa = 3.31EE95 pKa = 4.19YY96 pKa = 11.41KK97 pKa = 9.54ITDD100 pKa = 3.24DD101 pKa = 3.32TAYY104 pKa = 10.95DD105 pKa = 3.66FVDD108 pKa = 4.21FNLYY112 pKa = 10.72YY113 pKa = 9.8IDD115 pKa = 4.38EE116 pKa = 4.55NEE118 pKa = 3.82ADD120 pKa = 3.22GDD122 pKa = 3.57RR123 pKa = 11.84RR124 pKa = 11.84YY125 pKa = 9.23RR126 pKa = 11.84TNNIDD131 pKa = 3.54EE132 pKa = 5.07FIKK135 pKa = 10.41GSSYY139 pKa = 10.88RR140 pKa = 11.84EE141 pKa = 3.95EE142 pKa = 4.9LPLEE146 pKa = 4.19QQTIPYY152 pKa = 9.41IIEE155 pKa = 3.77LHH157 pKa = 6.54GEE159 pKa = 3.74DD160 pKa = 4.21VYY162 pKa = 11.27CIKK165 pKa = 10.93EE166 pKa = 4.01EE167 pKa = 4.37LLYY170 pKa = 9.92TQQ172 pKa = 4.65
Molecular weight: 20.26 kDa
Isoelectric point according different methods:
Protein with the highest isoelectric point:
>tr|A0A1Y4UQ75|A0A1Y4UQ75_9FIRM Citrate synthase OS=Tyzzerella sp. An114 OX=1965545 GN=B5E58_04525 PE=3 SV=1
MM1 pKa = 7.67KK2 pKa = 8.72MTFQPKK8 pKa = 8.95KK9 pKa = 7.58RR10 pKa = 11.84QRR12 pKa = 11.84SKK14 pKa = 9.07VHH16 pKa = 5.95GFRR19 pKa = 11.84KK20 pKa = 10.0RR21 pKa = 11.84MSTANGRR28 pKa = 11.84KK29 pKa = 8.81VLAARR34 pKa = 11.84RR35 pKa = 11.84RR36 pKa = 11.84KK37 pKa = 8.81GRR39 pKa = 11.84KK40 pKa = 8.75VLSAA44 pKa = 4.05
MM1 pKa = 7.67KK2 pKa = 8.72MTFQPKK8 pKa = 8.95KK9 pKa = 7.58RR10 pKa = 11.84QRR12 pKa = 11.84SKK14 pKa = 9.07VHH16 pKa = 5.95GFRR19 pKa = 11.84KK20 pKa = 10.0RR21 pKa = 11.84MSTANGRR28 pKa = 11.84KK29 pKa = 8.81VLAARR34 pKa = 11.84RR35 pKa = 11.84RR36 pKa = 11.84KK37 pKa = 8.81GRR39 pKa = 11.84KK40 pKa = 8.75VLSAA44 pKa = 4.05
Molecular weight: 5.18 kDa
Isoelectric point according different methods:
Peptides (in silico digests for buttom-up proteomics)
Below you can find in silico digests of the whole proteome with Trypsin, Chymotrypsin, Trypsin+LysC, LysN, ArgC proteases suitable for different mass spec machines.| Try ESI |
 |
|---|
| ChTry ESI |
 |
|---|
| ArgC ESI |
 |
|---|
| LysN ESI |
 |
|---|
| TryLysC ESI |
 |
|---|
| Try MALDI |
 |
|---|
| ChTry MALDI |
 |
|---|
| ArgC MALDI |
 |
|---|
| LysN MALDI |
 |
|---|
| TryLysC MALDI |
 |
|---|
| Try LTQ |
 |
|---|
| ChTry LTQ |
 |
|---|
| ArgC LTQ |
 |
|---|
| LysN LTQ |
 |
|---|
| TryLysC LTQ |
 |
|---|
| Try MSlow |
 |
|---|
| ChTry MSlow |
 |
|---|
| ArgC MSlow |
 |
|---|
| LysN MSlow |
 |
|---|
| TryLysC MSlow |
 |
|---|
| Try MShigh |
 |
|---|
| ChTry MShigh |
 |
|---|
| ArgC MShigh |
 |
|---|
| LysN MShigh |
 |
|---|
| TryLysC MShigh |
 |
|---|
General Statistics
Number of major isoforms |
Number of additional isoforms |
Number of all proteins |
Number of amino acids |
Min. Seq. Length |
Max. Seq. Length |
Avg. Seq. Length |
Avg. Mol. Weight |
|---|---|---|---|---|---|---|---|
0 |
804866 |
37 |
2606 |
315.8 |
35.55 |
Amino acid frequency
Ala |
Cys |
Asp |
Glu |
Phe |
Gly |
His |
Ile |
Lys |
Leu |
|---|---|---|---|---|---|---|---|---|---|
5.987 ± 0.053 | 1.341 ± 0.019 |
5.906 ± 0.039 | 7.681 ± 0.05 |
4.602 ± 0.036 | 6.723 ± 0.051 |
1.317 ± 0.019 | 9.547 ± 0.065 |
8.367 ± 0.05 | 7.726 ± 0.044 |
Met |
Asn |
Gln |
Pro |
Arg |
Ser |
Thr |
Val |
Trp |
Tyr |
|---|---|---|---|---|---|---|---|---|---|
2.862 ± 0.024 | 5.975 ± 0.043 |
2.925 ± 0.028 | 2.238 ± 0.023 |
3.417 ± 0.037 | 6.256 ± 0.046 |
5.389 ± 0.049 | 6.802 ± 0.036 |
0.699 ± 0.016 | 4.24 ± 0.033 |
Most of the basic statistics you can see at this page can be downloaded from this CSV file
Proteome-pI is available under Creative Commons Attribution-NoDerivs license, for more details see here
| Reference: Kozlowski LP. Proteome-pI 2.0: Proteome Isoelectric Point Database Update. Nucleic Acids Res. 2021, doi: 10.1093/nar/gkab944 | Contact: Lukasz P. Kozlowski |
