Alteromonadaceae bacterium 2753L.S.0a.02
Taxonomy: cellular organisms; Bacteria; Proteobacteria; Gammaproteobacteria; Alteromonadales; Alteromonadaceae; unclassified Alteromonadaceae
Average proteome isoelectric point is 6.16
Get precalculated fractions of proteins

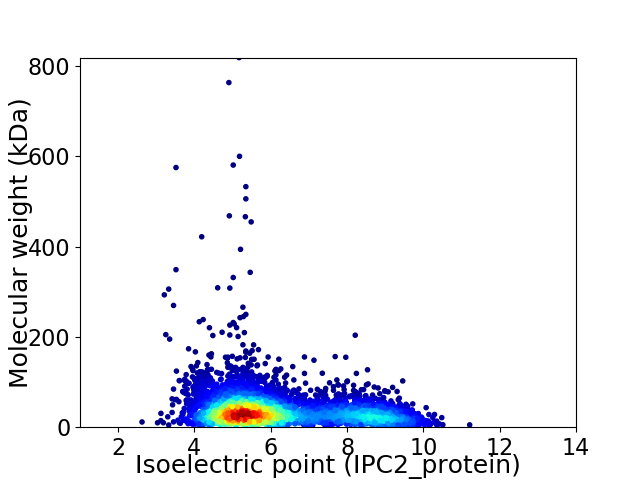
Virtual 2D-PAGE plot for 4947 proteins (isoelectric point calculated using IPC2_protein)
Get csv file with sequences according to given criteria:
* You can choose from 21 different methods for calculating isoelectric point
Summary statistics related to proteome-wise predictions


Protein with the lowest isoelectric point:
>tr|A0A559QPU8|A0A559QPU8_9ALTE Acetate kinase OS=Alteromonadaceae bacterium 2753L.S.0a.02 OX=1403320 GN=ackA PE=3 SV=1
MM1 pKa = 7.41KK2 pKa = 10.36FVFTTIARR10 pKa = 11.84LLGLSALTVSLPALATTVQFQTSMGDD36 pKa = 3.62FEE38 pKa = 5.21VVLYY42 pKa = 10.73DD43 pKa = 3.14QGTPATVANFLAYY56 pKa = 10.34VEE58 pKa = 4.77AGDD61 pKa = 3.82YY62 pKa = 10.05TDD64 pKa = 4.52TIIHH68 pKa = 6.59RR69 pKa = 11.84SVDD72 pKa = 3.34SFVIQGGGYY81 pKa = 9.59VFAEE85 pKa = 4.54SGAPDD90 pKa = 5.23AIDD93 pKa = 3.21TRR95 pKa = 11.84DD96 pKa = 3.53PVVNEE101 pKa = 3.67PVYY104 pKa = 11.01SNVRR108 pKa = 11.84GTIAMAKK115 pKa = 10.13VSGLLNSATSQWFINLSNNSFSLDD139 pKa = 3.3PYY141 pKa = 10.24NRR143 pKa = 11.84GGFTVFGEE151 pKa = 4.35VAEE154 pKa = 4.71GGMSIIDD161 pKa = 3.93SIAAVDD167 pKa = 4.02VFDD170 pKa = 4.44MGTGFDD176 pKa = 4.66EE177 pKa = 4.94IPLVDD182 pKa = 4.11YY183 pKa = 11.07TEE185 pKa = 4.31EE186 pKa = 4.71DD187 pKa = 4.08YY188 pKa = 11.85NNQIDD193 pKa = 4.07PTADD197 pKa = 3.24NAVTVYY203 pKa = 10.11TIVVTDD209 pKa = 4.86ADD211 pKa = 4.31PDD213 pKa = 3.89SAADD217 pKa = 4.38LDD219 pKa = 4.12PVPNNLYY226 pKa = 10.34EE227 pKa = 4.55EE228 pKa = 4.55PTPTPTPTPSSGDD241 pKa = 3.28GGGGGFPYY249 pKa = 11.02ALLLLLGGLSLVARR263 pKa = 11.84KK264 pKa = 9.69GSHH267 pKa = 5.6NSS269 pKa = 3.06
MM1 pKa = 7.41KK2 pKa = 10.36FVFTTIARR10 pKa = 11.84LLGLSALTVSLPALATTVQFQTSMGDD36 pKa = 3.62FEE38 pKa = 5.21VVLYY42 pKa = 10.73DD43 pKa = 3.14QGTPATVANFLAYY56 pKa = 10.34VEE58 pKa = 4.77AGDD61 pKa = 3.82YY62 pKa = 10.05TDD64 pKa = 4.52TIIHH68 pKa = 6.59RR69 pKa = 11.84SVDD72 pKa = 3.34SFVIQGGGYY81 pKa = 9.59VFAEE85 pKa = 4.54SGAPDD90 pKa = 5.23AIDD93 pKa = 3.21TRR95 pKa = 11.84DD96 pKa = 3.53PVVNEE101 pKa = 3.67PVYY104 pKa = 11.01SNVRR108 pKa = 11.84GTIAMAKK115 pKa = 10.13VSGLLNSATSQWFINLSNNSFSLDD139 pKa = 3.3PYY141 pKa = 10.24NRR143 pKa = 11.84GGFTVFGEE151 pKa = 4.35VAEE154 pKa = 4.71GGMSIIDD161 pKa = 3.93SIAAVDD167 pKa = 4.02VFDD170 pKa = 4.44MGTGFDD176 pKa = 4.66EE177 pKa = 4.94IPLVDD182 pKa = 4.11YY183 pKa = 11.07TEE185 pKa = 4.31EE186 pKa = 4.71DD187 pKa = 4.08YY188 pKa = 11.85NNQIDD193 pKa = 4.07PTADD197 pKa = 3.24NAVTVYY203 pKa = 10.11TIVVTDD209 pKa = 4.86ADD211 pKa = 4.31PDD213 pKa = 3.89SAADD217 pKa = 4.38LDD219 pKa = 4.12PVPNNLYY226 pKa = 10.34EE227 pKa = 4.55EE228 pKa = 4.55PTPTPTPTPSSGDD241 pKa = 3.28GGGGGFPYY249 pKa = 11.02ALLLLLGGLSLVARR263 pKa = 11.84KK264 pKa = 9.69GSHH267 pKa = 5.6NSS269 pKa = 3.06
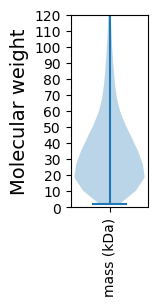
Molecular weight: 28.38 kDa
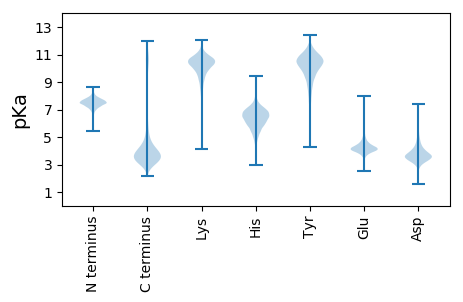
Isoelectric point according different methods:
Protein with the highest isoelectric point:
>tr|A0A559QVC9|A0A559QVC9_9ALTE Threonine/homoserine/homoserine lactone efflux protein OS=Alteromonadaceae bacterium 2753L.S.0a.02 OX=1403320 GN=P886_1179 PE=4 SV=1
MM1 pKa = 7.45KK2 pKa = 9.61RR3 pKa = 11.84TFQPSNLKK11 pKa = 10.2RR12 pKa = 11.84KK13 pKa = 7.57RR14 pKa = 11.84THH16 pKa = 5.9GFRR19 pKa = 11.84ARR21 pKa = 11.84MATKK25 pKa = 10.37NGRR28 pKa = 11.84KK29 pKa = 8.96VLARR33 pKa = 11.84RR34 pKa = 11.84RR35 pKa = 11.84AKK37 pKa = 9.97GRR39 pKa = 11.84KK40 pKa = 8.64VLAAA44 pKa = 4.31
MM1 pKa = 7.45KK2 pKa = 9.61RR3 pKa = 11.84TFQPSNLKK11 pKa = 10.2RR12 pKa = 11.84KK13 pKa = 7.57RR14 pKa = 11.84THH16 pKa = 5.9GFRR19 pKa = 11.84ARR21 pKa = 11.84MATKK25 pKa = 10.37NGRR28 pKa = 11.84KK29 pKa = 8.96VLARR33 pKa = 11.84RR34 pKa = 11.84RR35 pKa = 11.84AKK37 pKa = 9.97GRR39 pKa = 11.84KK40 pKa = 8.64VLAAA44 pKa = 4.31
Molecular weight: 5.15 kDa
Isoelectric point according different methods:
Peptides (in silico digests for buttom-up proteomics)
Below you can find in silico digests of the whole proteome with Trypsin, Chymotrypsin, Trypsin+LysC, LysN, ArgC proteases suitable for different mass spec machines.| Try ESI |
 |
|---|
| ChTry ESI |
 |
|---|
| ArgC ESI |
 |
|---|
| LysN ESI |
 |
|---|
| TryLysC ESI |
 |
|---|
| Try MALDI |
 |
|---|
| ChTry MALDI |
 |
|---|
| ArgC MALDI |
 |
|---|
| LysN MALDI |
 |
|---|
| TryLysC MALDI |
 |
|---|
| Try LTQ |
 |
|---|
| ChTry LTQ |
 |
|---|
| ArgC LTQ |
 |
|---|
| LysN LTQ |
 |
|---|
| TryLysC LTQ |
 |
|---|
| Try MSlow |
 |
|---|
| ChTry MSlow |
 |
|---|
| ArgC MSlow |
 |
|---|
| LysN MSlow |
 |
|---|
| TryLysC MSlow |
 |
|---|
| Try MShigh |
 |
|---|
| ChTry MShigh |
 |
|---|
| ArgC MShigh |
 |
|---|
| LysN MShigh |
 |
|---|
| TryLysC MShigh |
 |
|---|
General Statistics
Number of major isoforms |
Number of additional isoforms |
Number of all proteins |
Number of amino acids |
Min. Seq. Length |
Max. Seq. Length |
Avg. Seq. Length |
Avg. Mol. Weight |
|---|---|---|---|---|---|---|---|
0 |
1758315 |
19 |
7441 |
355.4 |
39.37 |
Amino acid frequency
Ala |
Cys |
Asp |
Glu |
Phe |
Gly |
His |
Ile |
Lys |
Leu |
|---|---|---|---|---|---|---|---|---|---|
9.009 ± 0.037 | 1.134 ± 0.016 |
5.609 ± 0.041 | 6.141 ± 0.035 |
4.137 ± 0.022 | 7.008 ± 0.043 |
2.183 ± 0.019 | 5.818 ± 0.026 |
4.584 ± 0.034 | 10.25 ± 0.047 |
Met |
Asn |
Gln |
Pro |
Arg |
Ser |
Thr |
Val |
Trp |
Tyr |
|---|---|---|---|---|---|---|---|---|---|
2.175 ± 0.02 | 4.559 ± 0.029 |
4.162 ± 0.024 | 4.324 ± 0.027 |
4.943 ± 0.029 | 7.182 ± 0.054 |
5.377 ± 0.033 | 6.798 ± 0.028 |
1.376 ± 0.016 | 3.232 ± 0.023 |
Most of the basic statistics you can see at this page can be downloaded from this CSV file
Proteome-pI is available under Creative Commons Attribution-NoDerivs license, for more details see here
| Reference: Kozlowski LP. Proteome-pI 2.0: Proteome Isoelectric Point Database Update. Nucleic Acids Res. 2021, doi: 10.1093/nar/gkab944 | Contact: Lukasz P. Kozlowski |
