Pelagibacter ubique (strain HTCC1062)
Taxonomy: cellular organisms; Bacteria; Proteobacteria; Alphaproteobacteria; Pelagibacterales; Pelagibacteraceae; Candidatus Pelagibacter; Candidatus Pelagibacter ubique
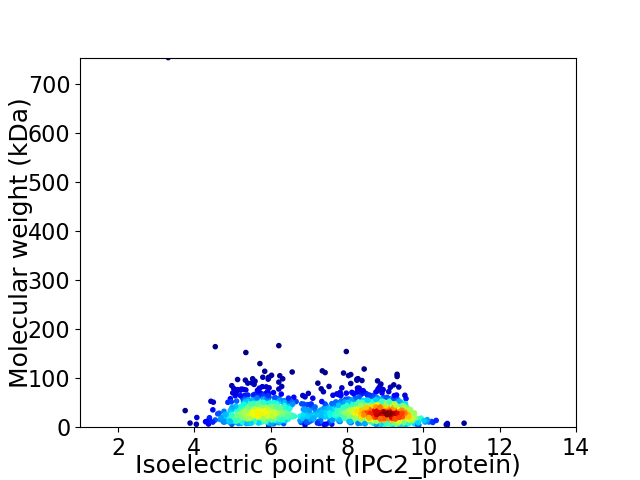
Average proteome isoelectric point is 7.4
Get precalculated fractions of proteins

Virtual 2D-PAGE plot for 1354 proteins (isoelectric point calculated using IPC2_protein)
Get csv file with sequences according to given criteria:
* You can choose from 21 different methods for calculating isoelectric point
Summary statistics related to proteome-wise predictions


Protein with the lowest isoelectric point:
>tr|Q4FNR8|Q4FNR8_PELUB Predicted O-linked N-acetylglucosamine transferase OS=Pelagibacter ubique (strain HTCC1062) OX=335992 GN=SAR11_0349 PE=4 SV=1
MM1 pKa = 7.47NNLKK5 pKa = 10.62KK6 pKa = 10.46IGLTALAGCLAVTSVHH22 pKa = 6.48ASEE25 pKa = 4.6LTASGSASIGFGGADD40 pKa = 3.66KK41 pKa = 9.95GTSANGFYY49 pKa = 10.55MNDD52 pKa = 3.03EE53 pKa = 4.39VTFSGSGEE61 pKa = 4.4LDD63 pKa = 3.26NGWNVTLSMQVDD75 pKa = 3.47NNEE78 pKa = 4.08NVGTSTFDD86 pKa = 3.37NRR88 pKa = 11.84SVTINMGDD96 pKa = 3.08AGTFAFGGHH105 pKa = 6.24GLDD108 pKa = 3.61SVVGGVDD115 pKa = 3.42DD116 pKa = 5.03VMPTAYY122 pKa = 10.5GEE124 pKa = 4.1TWDD127 pKa = 4.59IISNTVDD134 pKa = 2.95NGGVTSTASTLFGAIGSAGSNNMMRR159 pKa = 11.84YY160 pKa = 10.43DD161 pKa = 3.25NTTAVEE167 pKa = 4.05GLKK170 pKa = 10.16ISASYY175 pKa = 10.19VPSGTGEE182 pKa = 4.09VEE184 pKa = 3.96SSVDD188 pKa = 3.25YY189 pKa = 10.8GLEE192 pKa = 3.85YY193 pKa = 10.25TGYY196 pKa = 10.43EE197 pKa = 4.27GLTLGYY203 pKa = 11.52AMGEE207 pKa = 4.02NNAAGGTSNTDD218 pKa = 2.69NDD220 pKa = 3.82TMYY223 pKa = 11.19VKK225 pKa = 10.46YY226 pKa = 10.25AYY228 pKa = 10.36GPVTVGYY235 pKa = 9.7QKK237 pKa = 10.9SEE239 pKa = 3.64IDD241 pKa = 3.15ATTATDD247 pKa = 3.43TDD249 pKa = 3.09EE250 pKa = 3.82WTAYY254 pKa = 9.24GVTYY258 pKa = 10.48AVSDD262 pKa = 4.03SLSVGYY268 pKa = 10.72AEE270 pKa = 4.2STYY273 pKa = 11.22DD274 pKa = 3.53AGSSTTDD281 pKa = 3.15QEE283 pKa = 4.21NSNLSVSYY291 pKa = 8.81TQGGMTLAAGFAEE304 pKa = 4.36EE305 pKa = 4.44KK306 pKa = 10.68NRR308 pKa = 11.84GGLTTAVNDD317 pKa = 3.42VKK319 pKa = 11.14GYY321 pKa = 10.59DD322 pKa = 3.17ISLAFAFF329 pKa = 4.83
MM1 pKa = 7.47NNLKK5 pKa = 10.62KK6 pKa = 10.46IGLTALAGCLAVTSVHH22 pKa = 6.48ASEE25 pKa = 4.6LTASGSASIGFGGADD40 pKa = 3.66KK41 pKa = 9.95GTSANGFYY49 pKa = 10.55MNDD52 pKa = 3.03EE53 pKa = 4.39VTFSGSGEE61 pKa = 4.4LDD63 pKa = 3.26NGWNVTLSMQVDD75 pKa = 3.47NNEE78 pKa = 4.08NVGTSTFDD86 pKa = 3.37NRR88 pKa = 11.84SVTINMGDD96 pKa = 3.08AGTFAFGGHH105 pKa = 6.24GLDD108 pKa = 3.61SVVGGVDD115 pKa = 3.42DD116 pKa = 5.03VMPTAYY122 pKa = 10.5GEE124 pKa = 4.1TWDD127 pKa = 4.59IISNTVDD134 pKa = 2.95NGGVTSTASTLFGAIGSAGSNNMMRR159 pKa = 11.84YY160 pKa = 10.43DD161 pKa = 3.25NTTAVEE167 pKa = 4.05GLKK170 pKa = 10.16ISASYY175 pKa = 10.19VPSGTGEE182 pKa = 4.09VEE184 pKa = 3.96SSVDD188 pKa = 3.25YY189 pKa = 10.8GLEE192 pKa = 3.85YY193 pKa = 10.25TGYY196 pKa = 10.43EE197 pKa = 4.27GLTLGYY203 pKa = 11.52AMGEE207 pKa = 4.02NNAAGGTSNTDD218 pKa = 2.69NDD220 pKa = 3.82TMYY223 pKa = 11.19VKK225 pKa = 10.46YY226 pKa = 10.25AYY228 pKa = 10.36GPVTVGYY235 pKa = 9.7QKK237 pKa = 10.9SEE239 pKa = 3.64IDD241 pKa = 3.15ATTATDD247 pKa = 3.43TDD249 pKa = 3.09EE250 pKa = 3.82WTAYY254 pKa = 9.24GVTYY258 pKa = 10.48AVSDD262 pKa = 4.03SLSVGYY268 pKa = 10.72AEE270 pKa = 4.2STYY273 pKa = 11.22DD274 pKa = 3.53AGSSTTDD281 pKa = 3.15QEE283 pKa = 4.21NSNLSVSYY291 pKa = 8.81TQGGMTLAAGFAEE304 pKa = 4.36EE305 pKa = 4.44KK306 pKa = 10.68NRR308 pKa = 11.84GGLTTAVNDD317 pKa = 3.42VKK319 pKa = 11.14GYY321 pKa = 10.59DD322 pKa = 3.17ISLAFAFF329 pKa = 4.83
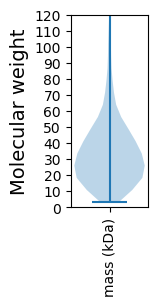
Molecular weight: 33.89 kDa
Isoelectric point according different methods:
Protein with the highest isoelectric point:
>sp|Q4FM56|SYE_PELUB Glutamate--tRNA ligase OS=Pelagibacter ubique (strain HTCC1062) OX=335992 GN=gltX PE=3 SV=1
MM1 pKa = 7.64KK2 pKa = 10.45KK3 pKa = 8.01ITKK6 pKa = 9.47NIKK9 pKa = 10.2VKK11 pKa = 10.5VASNKK16 pKa = 10.07KK17 pKa = 9.31KK18 pKa = 10.44VSGNILNAPKK28 pKa = 8.77THH30 pKa = 6.82KK31 pKa = 10.45LPRR34 pKa = 11.84VVKK37 pKa = 10.3ARR39 pKa = 11.84AGQTITGKK47 pKa = 10.21IGGIRR52 pKa = 11.84KK53 pKa = 7.48TPNKK57 pKa = 10.19SIAKK61 pKa = 8.93PGQTITGKK69 pKa = 9.6IRR71 pKa = 11.84RR72 pKa = 11.84RR73 pKa = 11.84TNN75 pKa = 2.63
MM1 pKa = 7.64KK2 pKa = 10.45KK3 pKa = 8.01ITKK6 pKa = 9.47NIKK9 pKa = 10.2VKK11 pKa = 10.5VASNKK16 pKa = 10.07KK17 pKa = 9.31KK18 pKa = 10.44VSGNILNAPKK28 pKa = 8.77THH30 pKa = 6.82KK31 pKa = 10.45LPRR34 pKa = 11.84VVKK37 pKa = 10.3ARR39 pKa = 11.84AGQTITGKK47 pKa = 10.21IGGIRR52 pKa = 11.84KK53 pKa = 7.48TPNKK57 pKa = 10.19SIAKK61 pKa = 8.93PGQTITGKK69 pKa = 9.6IRR71 pKa = 11.84RR72 pKa = 11.84RR73 pKa = 11.84TNN75 pKa = 2.63
Molecular weight: 8.17 kDa
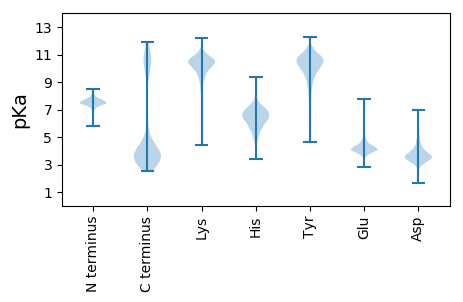
Isoelectric point according different methods:
Peptides (in silico digests for buttom-up proteomics)
Below you can find in silico digests of the whole proteome with Trypsin, Chymotrypsin, Trypsin+LysC, LysN, ArgC proteases suitable for different mass spec machines.| Try ESI |
 |
|---|
| ChTry ESI |
 |
|---|
| ArgC ESI |
 |
|---|
| LysN ESI |
 |
|---|
| TryLysC ESI |
 |
|---|
| Try MALDI |
 |
|---|
| ChTry MALDI |
 |
|---|
| ArgC MALDI |
 |
|---|
| LysN MALDI |
 |
|---|
| TryLysC MALDI |
 |
|---|
| Try LTQ |
 |
|---|
| ChTry LTQ |
 |
|---|
| ArgC LTQ |
 |
|---|
| LysN LTQ |
 |
|---|
| TryLysC LTQ |
 |
|---|
| Try MSlow |
 |
|---|
| ChTry MSlow |
 |
|---|
| ArgC MSlow |
 |
|---|
| LysN MSlow |
 |
|---|
| TryLysC MSlow |
 |
|---|
| Try MShigh |
 |
|---|
| ChTry MShigh |
 |
|---|
| ArgC MShigh |
 |
|---|
| LysN MShigh |
 |
|---|
| TryLysC MShigh |
 |
|---|
General Statistics
Number of major isoforms |
Number of additional isoforms |
Number of all proteins |
Number of amino acids |
Min. Seq. Length |
Max. Seq. Length |
Avg. Seq. Length |
Avg. Mol. Weight |
|---|---|---|---|---|---|---|---|
0 |
416540 |
29 |
7317 |
307.6 |
34.68 |
Amino acid frequency
Ala |
Cys |
Asp |
Glu |
Phe |
Gly |
His |
Ile |
Lys |
Leu |
|---|---|---|---|---|---|---|---|---|---|
5.717 ± 0.094 | 0.957 ± 0.026 |
5.402 ± 0.116 | 6.029 ± 0.083 |
5.219 ± 0.07 | 6.315 ± 0.076 |
1.565 ± 0.031 | 9.533 ± 0.105 |
10.231 ± 0.169 | 9.394 ± 0.094 |
Met |
Asn |
Gln |
Pro |
Arg |
Ser |
Thr |
Val |
Trp |
Tyr |
|---|---|---|---|---|---|---|---|---|---|
2.224 ± 0.037 | 6.526 ± 0.055 |
3.191 ± 0.041 | 2.631 ± 0.03 |
3.117 ± 0.057 | 6.92 ± 0.096 |
5.112 ± 0.181 | 5.662 ± 0.06 |
0.906 ± 0.025 | 3.349 ± 0.037 |
Most of the basic statistics you can see at this page can be downloaded from this CSV file
Proteome-pI is available under Creative Commons Attribution-NoDerivs license, for more details see here
| Reference: Kozlowski LP. Proteome-pI 2.0: Proteome Isoelectric Point Database Update. Nucleic Acids Res. 2021, doi: 10.1093/nar/gkab944 | Contact: Lukasz P. Kozlowski |
