Paracoccus zhejiangensis
Taxonomy: cellular organisms; Bacteria; Proteobacteria; Alphaproteobacteria; Rhodobacterales; Rhodobacteraceae; Paracoccus
Average proteome isoelectric point is 6.19
Get precalculated fractions of proteins

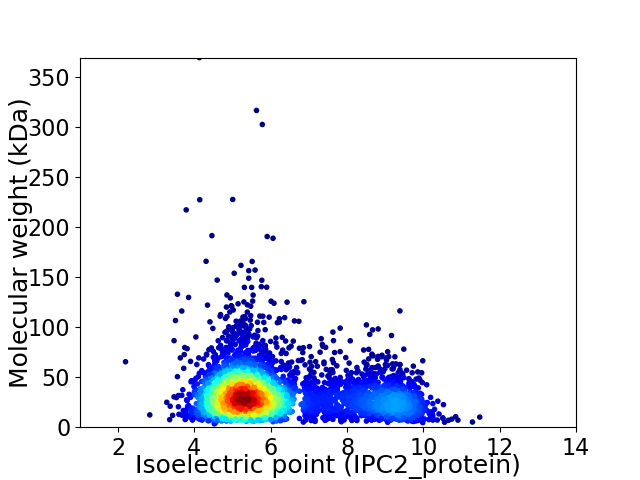
Virtual 2D-PAGE plot for 4274 proteins (isoelectric point calculated using IPC2_protein)
Get csv file with sequences according to given criteria:
* You can choose from 21 different methods for calculating isoelectric point
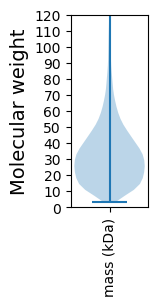
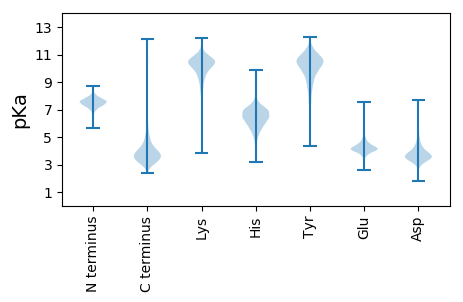
Summary statistics related to proteome-wise predictions


Protein with the lowest isoelectric point:
>tr|A0A2H5F496|A0A2H5F496_9RHOB Uncharacterized protein OS=Paracoccus zhejiangensis OX=1077935 GN=CX676_14425 PE=4 SV=1
MM1 pKa = 7.56KK2 pKa = 10.26LAIAAVAATLTAGSAFAGGYY22 pKa = 6.21TSPVVEE28 pKa = 4.7TPVIAPVAPVAVDD41 pKa = 5.07AGTDD45 pKa = 3.12WTGFYY50 pKa = 10.75AGLQYY55 pKa = 11.26GQGNAEE61 pKa = 4.11ASLGGDD67 pKa = 3.09NVEE70 pKa = 4.85SDD72 pKa = 3.29FDD74 pKa = 4.23AYY76 pKa = 10.38GVHH79 pKa = 6.64GGYY82 pKa = 9.68NHH84 pKa = 7.79DD85 pKa = 3.86FGNYY89 pKa = 7.67VLGGEE94 pKa = 4.28LDD96 pKa = 3.89YY97 pKa = 11.94NKK99 pKa = 10.0VDD101 pKa = 5.38LDD103 pKa = 4.54DD104 pKa = 5.57ADD106 pKa = 4.3GDD108 pKa = 3.92ADD110 pKa = 3.86LWRR113 pKa = 11.84LRR115 pKa = 11.84GRR117 pKa = 11.84AGYY120 pKa = 11.03DD121 pKa = 2.81MGKK124 pKa = 9.73FLPYY128 pKa = 8.71VTLGAAHH135 pKa = 7.3ISGDD139 pKa = 3.61NDD141 pKa = 3.4LSEE144 pKa = 4.29TDD146 pKa = 3.27VTYY149 pKa = 10.66GIGGEE154 pKa = 4.2YY155 pKa = 9.7MVTDD159 pKa = 4.5RR160 pKa = 11.84FTVGAEE166 pKa = 3.74YY167 pKa = 9.85TKK169 pKa = 10.7QDD171 pKa = 3.3FSDD174 pKa = 3.71VQNVDD179 pKa = 3.77GLDD182 pKa = 3.7LDD184 pKa = 3.82SDD186 pKa = 4.28MVQVRR191 pKa = 11.84ASFRR195 pKa = 11.84FF196 pKa = 3.43
MM1 pKa = 7.56KK2 pKa = 10.26LAIAAVAATLTAGSAFAGGYY22 pKa = 6.21TSPVVEE28 pKa = 4.7TPVIAPVAPVAVDD41 pKa = 5.07AGTDD45 pKa = 3.12WTGFYY50 pKa = 10.75AGLQYY55 pKa = 11.26GQGNAEE61 pKa = 4.11ASLGGDD67 pKa = 3.09NVEE70 pKa = 4.85SDD72 pKa = 3.29FDD74 pKa = 4.23AYY76 pKa = 10.38GVHH79 pKa = 6.64GGYY82 pKa = 9.68NHH84 pKa = 7.79DD85 pKa = 3.86FGNYY89 pKa = 7.67VLGGEE94 pKa = 4.28LDD96 pKa = 3.89YY97 pKa = 11.94NKK99 pKa = 10.0VDD101 pKa = 5.38LDD103 pKa = 4.54DD104 pKa = 5.57ADD106 pKa = 4.3GDD108 pKa = 3.92ADD110 pKa = 3.86LWRR113 pKa = 11.84LRR115 pKa = 11.84GRR117 pKa = 11.84AGYY120 pKa = 11.03DD121 pKa = 2.81MGKK124 pKa = 9.73FLPYY128 pKa = 8.71VTLGAAHH135 pKa = 7.3ISGDD139 pKa = 3.61NDD141 pKa = 3.4LSEE144 pKa = 4.29TDD146 pKa = 3.27VTYY149 pKa = 10.66GIGGEE154 pKa = 4.2YY155 pKa = 9.7MVTDD159 pKa = 4.5RR160 pKa = 11.84FTVGAEE166 pKa = 3.74YY167 pKa = 9.85TKK169 pKa = 10.7QDD171 pKa = 3.3FSDD174 pKa = 3.71VQNVDD179 pKa = 3.77GLDD182 pKa = 3.7LDD184 pKa = 3.82SDD186 pKa = 4.28MVQVRR191 pKa = 11.84ASFRR195 pKa = 11.84FF196 pKa = 3.43
Molecular weight: 20.74 kDa
Isoelectric point according different methods:
Protein with the highest isoelectric point:
>tr|A0A2H5F3C7|A0A2H5F3C7_9RHOB Glutathione S-transferase OS=Paracoccus zhejiangensis OX=1077935 GN=CX676_19340 PE=4 SV=1
MM1 pKa = 7.45KK2 pKa = 9.61RR3 pKa = 11.84TFQPSNLVRR12 pKa = 11.84ARR14 pKa = 11.84RR15 pKa = 11.84HH16 pKa = 4.37GFRR19 pKa = 11.84ARR21 pKa = 11.84MATKK25 pKa = 10.41AGRR28 pKa = 11.84LVLNRR33 pKa = 11.84RR34 pKa = 11.84RR35 pKa = 11.84AKK37 pKa = 9.7GRR39 pKa = 11.84KK40 pKa = 8.85RR41 pKa = 11.84LSAA44 pKa = 3.96
MM1 pKa = 7.45KK2 pKa = 9.61RR3 pKa = 11.84TFQPSNLVRR12 pKa = 11.84ARR14 pKa = 11.84RR15 pKa = 11.84HH16 pKa = 4.37GFRR19 pKa = 11.84ARR21 pKa = 11.84MATKK25 pKa = 10.41AGRR28 pKa = 11.84LVLNRR33 pKa = 11.84RR34 pKa = 11.84RR35 pKa = 11.84AKK37 pKa = 9.7GRR39 pKa = 11.84KK40 pKa = 8.85RR41 pKa = 11.84LSAA44 pKa = 3.96
Molecular weight: 5.18 kDa
Isoelectric point according different methods:
Peptides (in silico digests for buttom-up proteomics)
Below you can find in silico digests of the whole proteome with Trypsin, Chymotrypsin, Trypsin+LysC, LysN, ArgC proteases suitable for different mass spec machines.| Try ESI |
 |
|---|
| ChTry ESI |
 |
|---|
| ArgC ESI |
 |
|---|
| LysN ESI |
 |
|---|
| TryLysC ESI |
 |
|---|
| Try MALDI |
 |
|---|
| ChTry MALDI |
 |
|---|
| ArgC MALDI |
 |
|---|
| LysN MALDI |
 |
|---|
| TryLysC MALDI |
 |
|---|
| Try LTQ |
 |
|---|
| ChTry LTQ |
 |
|---|
| ArgC LTQ |
 |
|---|
| LysN LTQ |
 |
|---|
| TryLysC LTQ |
 |
|---|
| Try MSlow |
 |
|---|
| ChTry MSlow |
 |
|---|
| ArgC MSlow |
 |
|---|
| LysN MSlow |
 |
|---|
| TryLysC MSlow |
 |
|---|
| Try MShigh |
 |
|---|
| ChTry MShigh |
 |
|---|
| ArgC MShigh |
 |
|---|
| LysN MShigh |
 |
|---|
| TryLysC MShigh |
 |
|---|
General Statistics
Number of major isoforms |
Number of additional isoforms |
Number of all proteins |
Number of amino acids |
Min. Seq. Length |
Max. Seq. Length |
Avg. Seq. Length |
Avg. Mol. Weight |
|---|---|---|---|---|---|---|---|
0 |
1366512 |
30 |
3588 |
319.7 |
34.58 |
Amino acid frequency
Ala |
Cys |
Asp |
Glu |
Phe |
Gly |
His |
Ile |
Lys |
Leu |
|---|---|---|---|---|---|---|---|---|---|
12.948 ± 0.046 | 0.799 ± 0.011 |
5.971 ± 0.03 | 5.715 ± 0.036 |
3.539 ± 0.025 | 9.051 ± 0.046 |
2.004 ± 0.019 | 5.187 ± 0.027 |
2.694 ± 0.032 | 10.333 ± 0.052 |
Met |
Asn |
Gln |
Pro |
Arg |
Ser |
Thr |
Val |
Trp |
Tyr |
|---|---|---|---|---|---|---|---|---|---|
2.737 ± 0.02 | 2.44 ± 0.024 |
5.406 ± 0.028 | 3.267 ± 0.021 |
7.125 ± 0.046 | 4.989 ± 0.024 |
5.258 ± 0.037 | 6.97 ± 0.03 |
1.478 ± 0.014 | 2.088 ± 0.018 |
Most of the basic statistics you can see at this page can be downloaded from this CSV file
Proteome-pI is available under Creative Commons Attribution-NoDerivs license, for more details see here
| Reference: Kozlowski LP. Proteome-pI 2.0: Proteome Isoelectric Point Database Update. Nucleic Acids Res. 2021, doi: 10.1093/nar/gkab944 | Contact: Lukasz P. Kozlowski |
