Scandinavium goeteborgense
Taxonomy: cellular organisms; Bacteria; Proteobacteria; Gammaproteobacteria; Enterobacterales;
Average proteome isoelectric point is 6.45
Get precalculated fractions of proteins

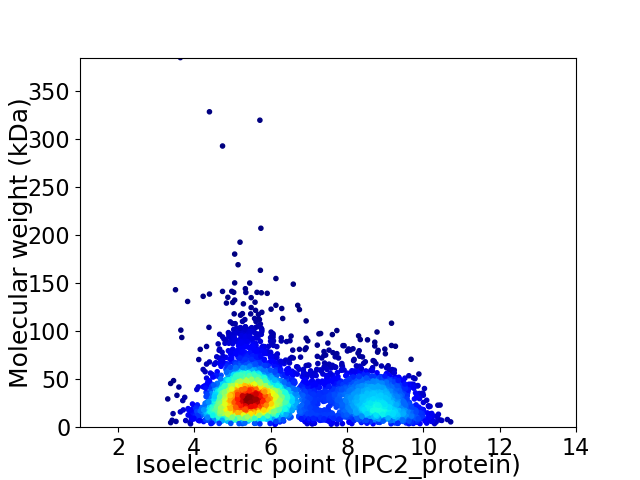
Virtual 2D-PAGE plot for 4446 proteins (isoelectric point calculated using IPC2_protein)
Get csv file with sequences according to given criteria:
* You can choose from 21 different methods for calculating isoelectric point
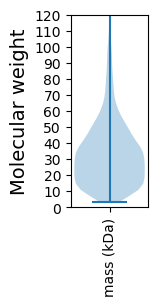
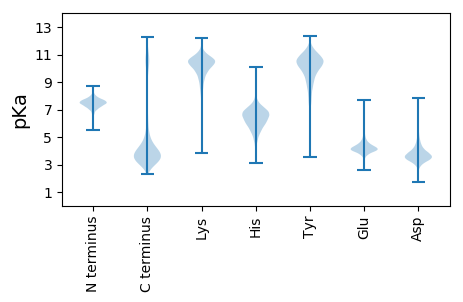
Summary statistics related to proteome-wise predictions


Protein with the lowest isoelectric point:
>tr|A0A4R6DP91|A0A4R6DP91_9ENTR Outer membrane autotransporter protein OS=Scandinavium goeteborgense OX=1851514 GN=EC847_1401 PE=4 SV=1
MM1 pKa = 7.27RR2 pKa = 11.84TMVQDD7 pKa = 3.75EE8 pKa = 4.6LCDD11 pKa = 3.82YY12 pKa = 11.12DD13 pKa = 5.4IDD15 pKa = 5.16DD16 pKa = 4.94EE17 pKa = 5.19IYY19 pKa = 10.72FNKK22 pKa = 10.16EE23 pKa = 3.65DD24 pKa = 4.82LKK26 pKa = 11.52DD27 pKa = 3.96GDD29 pKa = 4.41DD30 pKa = 4.32SYY32 pKa = 12.07LGAQDD37 pKa = 3.98QNGDD41 pKa = 3.39NTGTIHH47 pKa = 6.53ICWSSLIFMRR57 pKa = 11.84IGVV60 pKa = 3.69
MM1 pKa = 7.27RR2 pKa = 11.84TMVQDD7 pKa = 3.75EE8 pKa = 4.6LCDD11 pKa = 3.82YY12 pKa = 11.12DD13 pKa = 5.4IDD15 pKa = 5.16DD16 pKa = 4.94EE17 pKa = 5.19IYY19 pKa = 10.72FNKK22 pKa = 10.16EE23 pKa = 3.65DD24 pKa = 4.82LKK26 pKa = 11.52DD27 pKa = 3.96GDD29 pKa = 4.41DD30 pKa = 4.32SYY32 pKa = 12.07LGAQDD37 pKa = 3.98QNGDD41 pKa = 3.39NTGTIHH47 pKa = 6.53ICWSSLIFMRR57 pKa = 11.84IGVV60 pKa = 3.69
Molecular weight: 6.92 kDa
Isoelectric point according different methods:
Protein with the highest isoelectric point:
>tr|A0A4R6EMU1|A0A4R6EMU1_9ENTR Ditrans polycis-undecaprenyl-diphosphate synthase ((2E 6E)-farnesyl-diphosphate specific) OS=Scandinavium goeteborgense OX=1851514 GN=uppS PE=3 SV=1
MM1 pKa = 8.0RR2 pKa = 11.84ISCHH6 pKa = 5.74NRR8 pKa = 11.84VLLLLVLIALAAAALPFVNYY28 pKa = 10.31APNRR32 pKa = 11.84LVSGEE37 pKa = 4.34SRR39 pKa = 11.84QLWQIWTFPPALLLIVPLVFVGLSLLRR66 pKa = 11.84GRR68 pKa = 11.84GALALTLVLAQVLFILLLWSGGKK91 pKa = 9.65AATTLAQSGSPLARR105 pKa = 11.84TSPGSGLWLWLAVALLICSEE125 pKa = 4.71AIRR128 pKa = 11.84RR129 pKa = 11.84LTQKK133 pKa = 10.79SLWRR137 pKa = 11.84WLLNAQIWIIPVALLLSGEE156 pKa = 4.4LDD158 pKa = 3.4SLSLMKK164 pKa = 10.4EE165 pKa = 3.8YY166 pKa = 10.71FNRR169 pKa = 11.84QDD171 pKa = 3.39VFDD174 pKa = 4.5SALQQHH180 pKa = 7.37LILLFGTLLPGLLIGVPLGLWCWRR204 pKa = 11.84HH205 pKa = 5.22QGRR208 pKa = 11.84QTRR211 pKa = 11.84VFTVLNIIQTIPSVALFGLLIAPLAGLVKK240 pKa = 10.39HH241 pKa = 6.22FPWLSAWGIGGTGLTPALIALVLYY265 pKa = 10.73ALLPLVRR272 pKa = 11.84GVVAGMQQVAADD284 pKa = 3.91VLEE287 pKa = 4.64SASAMGMSQTQRR299 pKa = 11.84FWKK302 pKa = 9.96VQLPLALPVLLRR314 pKa = 11.84SLRR317 pKa = 11.84VVTVQTVGMAVVAALIGAGGFGALVFQGLLSSALDD352 pKa = 3.67LVLLGVIPVIAMAVVVDD369 pKa = 4.44ALFSLWIALLGGEE382 pKa = 4.37AHH384 pKa = 7.38DD385 pKa = 4.16
MM1 pKa = 8.0RR2 pKa = 11.84ISCHH6 pKa = 5.74NRR8 pKa = 11.84VLLLLVLIALAAAALPFVNYY28 pKa = 10.31APNRR32 pKa = 11.84LVSGEE37 pKa = 4.34SRR39 pKa = 11.84QLWQIWTFPPALLLIVPLVFVGLSLLRR66 pKa = 11.84GRR68 pKa = 11.84GALALTLVLAQVLFILLLWSGGKK91 pKa = 9.65AATTLAQSGSPLARR105 pKa = 11.84TSPGSGLWLWLAVALLICSEE125 pKa = 4.71AIRR128 pKa = 11.84RR129 pKa = 11.84LTQKK133 pKa = 10.79SLWRR137 pKa = 11.84WLLNAQIWIIPVALLLSGEE156 pKa = 4.4LDD158 pKa = 3.4SLSLMKK164 pKa = 10.4EE165 pKa = 3.8YY166 pKa = 10.71FNRR169 pKa = 11.84QDD171 pKa = 3.39VFDD174 pKa = 4.5SALQQHH180 pKa = 7.37LILLFGTLLPGLLIGVPLGLWCWRR204 pKa = 11.84HH205 pKa = 5.22QGRR208 pKa = 11.84QTRR211 pKa = 11.84VFTVLNIIQTIPSVALFGLLIAPLAGLVKK240 pKa = 10.39HH241 pKa = 6.22FPWLSAWGIGGTGLTPALIALVLYY265 pKa = 10.73ALLPLVRR272 pKa = 11.84GVVAGMQQVAADD284 pKa = 3.91VLEE287 pKa = 4.64SASAMGMSQTQRR299 pKa = 11.84FWKK302 pKa = 9.96VQLPLALPVLLRR314 pKa = 11.84SLRR317 pKa = 11.84VVTVQTVGMAVVAALIGAGGFGALVFQGLLSSALDD352 pKa = 3.67LVLLGVIPVIAMAVVVDD369 pKa = 4.44ALFSLWIALLGGEE382 pKa = 4.37AHH384 pKa = 7.38DD385 pKa = 4.16
Molecular weight: 41.37 kDa
Isoelectric point according different methods:
Peptides (in silico digests for buttom-up proteomics)
Below you can find in silico digests of the whole proteome with Trypsin, Chymotrypsin, Trypsin+LysC, LysN, ArgC proteases suitable for different mass spec machines.| Try ESI |
 |
|---|
| ChTry ESI |
 |
|---|
| ArgC ESI |
 |
|---|
| LysN ESI |
 |
|---|
| TryLysC ESI |
 |
|---|
| Try MALDI |
 |
|---|
| ChTry MALDI |
 |
|---|
| ArgC MALDI |
 |
|---|
| LysN MALDI |
 |
|---|
| TryLysC MALDI |
 |
|---|
| Try LTQ |
 |
|---|
| ChTry LTQ |
 |
|---|
| ArgC LTQ |
 |
|---|
| LysN LTQ |
 |
|---|
| TryLysC LTQ |
 |
|---|
| Try MSlow |
 |
|---|
| ChTry MSlow |
 |
|---|
| ArgC MSlow |
 |
|---|
| LysN MSlow |
 |
|---|
| TryLysC MSlow |
 |
|---|
| Try MShigh |
 |
|---|
| ChTry MShigh |
 |
|---|
| ArgC MShigh |
 |
|---|
| LysN MShigh |
 |
|---|
| TryLysC MShigh |
 |
|---|
General Statistics
Number of major isoforms |
Number of additional isoforms |
Number of all proteins |
Number of amino acids |
Min. Seq. Length |
Max. Seq. Length |
Avg. Seq. Length |
Avg. Mol. Weight |
|---|---|---|---|---|---|---|---|
0 |
1402276 |
29 |
3856 |
315.4 |
34.82 |
Amino acid frequency
Ala |
Cys |
Asp |
Glu |
Phe |
Gly |
His |
Ile |
Lys |
Leu |
|---|---|---|---|---|---|---|---|---|---|
9.73 ± 0.041 | 1.006 ± 0.012 |
5.362 ± 0.033 | 5.542 ± 0.036 |
3.842 ± 0.025 | 7.497 ± 0.037 |
2.281 ± 0.017 | 5.613 ± 0.03 |
4.22 ± 0.031 | 10.772 ± 0.047 |
Met |
Asn |
Gln |
Pro |
Arg |
Ser |
Thr |
Val |
Trp |
Tyr |
|---|---|---|---|---|---|---|---|---|---|
2.836 ± 0.019 | 3.816 ± 0.03 |
4.432 ± 0.026 | 4.529 ± 0.03 |
5.491 ± 0.037 | 6.074 ± 0.033 |
5.535 ± 0.038 | 7.174 ± 0.03 |
1.526 ± 0.018 | 2.724 ± 0.02 |
Most of the basic statistics you can see at this page can be downloaded from this CSV file
Proteome-pI is available under Creative Commons Attribution-NoDerivs license, for more details see here
| Reference: Kozlowski LP. Proteome-pI 2.0: Proteome Isoelectric Point Database Update. Nucleic Acids Res. 2021, doi: 10.1093/nar/gkab944 | Contact: Lukasz P. Kozlowski |
