Beggiatoa sp. SS
Taxonomy: cellular organisms; Bacteria; Proteobacteria; Gammaproteobacteria; Thiotrichales; Thiotrichaceae; Beggiatoa; unclassified Beggiatoa
Average proteome isoelectric point is 6.92
Get precalculated fractions of proteins

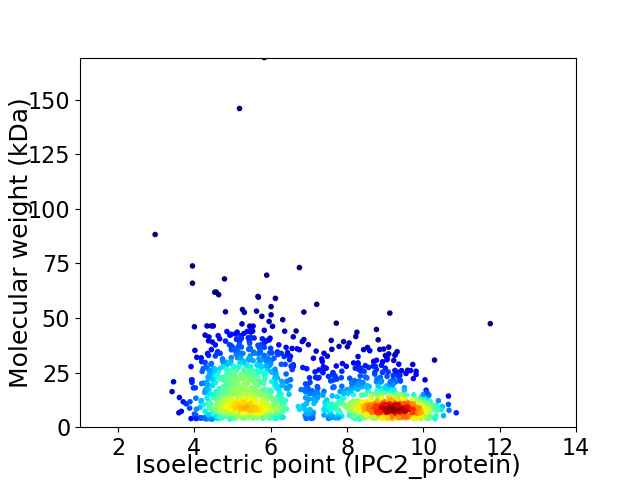
Virtual 2D-PAGE plot for 1437 proteins (isoelectric point calculated using IPC2_protein)
Get csv file with sequences according to given criteria:
* You can choose from 21 different methods for calculating isoelectric point
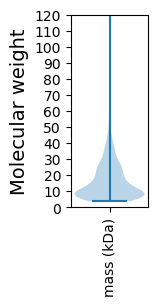
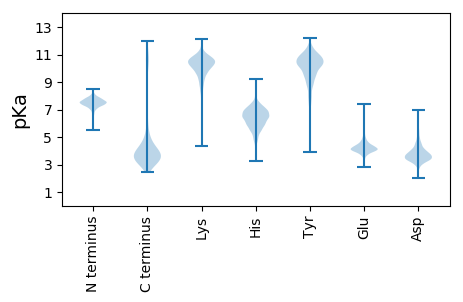
Summary statistics related to proteome-wise predictions


Protein with the lowest isoelectric point:
>tr|A7BL97|A7BL97_9GAMM Uncharacterized protein OS=Beggiatoa sp. SS OX=422288 GN=BGS_0189 PE=4 SV=1
MM1 pKa = 8.1PDD3 pKa = 3.22GTSVSLFTKK12 pKa = 10.34GGTIGQSIGGGAFTTTTEE30 pKa = 4.21LGRR33 pKa = 11.84ATAILQSANPSTPLLGGVATYY54 pKa = 10.86RR55 pKa = 11.84EE56 pKa = 4.0VGYY59 pKa = 10.62DD60 pKa = 3.2CSGNYY65 pKa = 10.51AFVTSPGTPLLLCSNPGLVTIVAFTTGSEE94 pKa = 4.25SFVDD98 pKa = 3.55KK99 pKa = 11.12NGNGLYY105 pKa = 10.63DD106 pKa = 4.6ADD108 pKa = 5.8DD109 pKa = 4.32SFTDD113 pKa = 2.97ICEE116 pKa = 4.03PFIDD120 pKa = 5.15GNDD123 pKa = 3.18NGQFDD128 pKa = 4.21EE129 pKa = 5.06GEE131 pKa = 4.23LYY133 pKa = 10.23IDD135 pKa = 4.01VNSNGAFDD143 pKa = 3.72TGNGQFDD150 pKa = 4.45GPGGPSEE157 pKa = 4.55NTTIWYY163 pKa = 6.47STRR166 pKa = 11.84VLFSDD171 pKa = 3.98RR172 pKa = 11.84TAPIQVKK179 pKa = 8.84PASFSIPNGGSEE191 pKa = 4.26TFTIQNISDD200 pKa = 3.47IYY202 pKa = 11.28GNALVKK208 pKa = 10.72NSQFNVTTNNGKK220 pKa = 10.18LGGVTHH226 pKa = 6.31FTFGDD231 pKa = 4.04SNTPAQSGIQFTLSSNPCSNSVTNEE256 pKa = 4.0DD257 pKa = 3.39GSVTEE262 pKa = 4.63KK263 pKa = 10.89CPPPP267 pKa = 4.78
MM1 pKa = 8.1PDD3 pKa = 3.22GTSVSLFTKK12 pKa = 10.34GGTIGQSIGGGAFTTTTEE30 pKa = 4.21LGRR33 pKa = 11.84ATAILQSANPSTPLLGGVATYY54 pKa = 10.86RR55 pKa = 11.84EE56 pKa = 4.0VGYY59 pKa = 10.62DD60 pKa = 3.2CSGNYY65 pKa = 10.51AFVTSPGTPLLLCSNPGLVTIVAFTTGSEE94 pKa = 4.25SFVDD98 pKa = 3.55KK99 pKa = 11.12NGNGLYY105 pKa = 10.63DD106 pKa = 4.6ADD108 pKa = 5.8DD109 pKa = 4.32SFTDD113 pKa = 2.97ICEE116 pKa = 4.03PFIDD120 pKa = 5.15GNDD123 pKa = 3.18NGQFDD128 pKa = 4.21EE129 pKa = 5.06GEE131 pKa = 4.23LYY133 pKa = 10.23IDD135 pKa = 4.01VNSNGAFDD143 pKa = 3.72TGNGQFDD150 pKa = 4.45GPGGPSEE157 pKa = 4.55NTTIWYY163 pKa = 6.47STRR166 pKa = 11.84VLFSDD171 pKa = 3.98RR172 pKa = 11.84TAPIQVKK179 pKa = 8.84PASFSIPNGGSEE191 pKa = 4.26TFTIQNISDD200 pKa = 3.47IYY202 pKa = 11.28GNALVKK208 pKa = 10.72NSQFNVTTNNGKK220 pKa = 10.18LGGVTHH226 pKa = 6.31FTFGDD231 pKa = 4.04SNTPAQSGIQFTLSSNPCSNSVTNEE256 pKa = 4.0DD257 pKa = 3.39GSVTEE262 pKa = 4.63KK263 pKa = 10.89CPPPP267 pKa = 4.78
Molecular weight: 27.76 kDa
Isoelectric point according different methods:
Protein with the highest isoelectric point:
>tr|A7BMI9|A7BMI9_9GAMM Extracellular ligand-binding receptor OS=Beggiatoa sp. SS OX=422288 GN=BGS_0341 PE=4 SV=1
MM1 pKa = 7.57ASVSISCPSCSATDD15 pKa = 3.7GVVRR19 pKa = 11.84NGKK22 pKa = 8.27STAGHH27 pKa = 4.88QRR29 pKa = 11.84YY30 pKa = 8.94LCSHH34 pKa = 6.46CRR36 pKa = 11.84KK37 pKa = 7.49TWQLQFTYY45 pKa = 9.73TASQPGTHH53 pKa = 5.79QKK55 pKa = 10.33IIDD58 pKa = 3.52MAMNGVGCRR67 pKa = 11.84ATARR71 pKa = 11.84IMGVGLNTILRR82 pKa = 11.84HH83 pKa = 5.55LKK85 pKa = 10.06NSGRR89 pKa = 11.84SRR91 pKa = 3.37
MM1 pKa = 7.57ASVSISCPSCSATDD15 pKa = 3.7GVVRR19 pKa = 11.84NGKK22 pKa = 8.27STAGHH27 pKa = 4.88QRR29 pKa = 11.84YY30 pKa = 8.94LCSHH34 pKa = 6.46CRR36 pKa = 11.84KK37 pKa = 7.49TWQLQFTYY45 pKa = 9.73TASQPGTHH53 pKa = 5.79QKK55 pKa = 10.33IIDD58 pKa = 3.52MAMNGVGCRR67 pKa = 11.84ATARR71 pKa = 11.84IMGVGLNTILRR82 pKa = 11.84HH83 pKa = 5.55LKK85 pKa = 10.06NSGRR89 pKa = 11.84SRR91 pKa = 3.37
Molecular weight: 9.87 kDa
Isoelectric point according different methods:
Peptides (in silico digests for buttom-up proteomics)
Below you can find in silico digests of the whole proteome with Trypsin, Chymotrypsin, Trypsin+LysC, LysN, ArgC proteases suitable for different mass spec machines.| Try ESI |
 |
|---|
| ChTry ESI |
 |
|---|
| ArgC ESI |
 |
|---|
| LysN ESI |
 |
|---|
| TryLysC ESI |
 |
|---|
| Try MALDI |
 |
|---|
| ChTry MALDI |
 |
|---|
| ArgC MALDI |
 |
|---|
| LysN MALDI |
 |
|---|
| TryLysC MALDI |
 |
|---|
| Try LTQ |
 |
|---|
| ChTry LTQ |
 |
|---|
| ArgC LTQ |
 |
|---|
| LysN LTQ |
 |
|---|
| TryLysC LTQ |
 |
|---|
| Try MSlow |
 |
|---|
| ChTry MSlow |
 |
|---|
| ArgC MSlow |
 |
|---|
| LysN MSlow |
 |
|---|
| TryLysC MSlow |
 |
|---|
| Try MShigh |
 |
|---|
| ChTry MShigh |
 |
|---|
| ArgC MShigh |
 |
|---|
| LysN MShigh |
 |
|---|
| TryLysC MShigh |
 |
|---|
General Statistics
Number of major isoforms |
Number of additional isoforms |
Number of all proteins |
Number of amino acids |
Min. Seq. Length |
Max. Seq. Length |
Avg. Seq. Length |
Avg. Mol. Weight |
|---|---|---|---|---|---|---|---|
0 |
212427 |
35 |
1482 |
147.8 |
16.55 |
Amino acid frequency
Ala |
Cys |
Asp |
Glu |
Phe |
Gly |
His |
Ile |
Lys |
Leu |
|---|---|---|---|---|---|---|---|---|---|
7.347 ± 0.085 | 1.232 ± 0.036 |
4.96 ± 0.107 | 5.858 ± 0.086 |
4.458 ± 0.073 | 6.729 ± 0.099 |
2.472 ± 0.043 | 6.575 ± 0.068 |
5.509 ± 0.074 | 10.562 ± 0.114 |
Met |
Asn |
Gln |
Pro |
Arg |
Ser |
Thr |
Val |
Trp |
Tyr |
|---|---|---|---|---|---|---|---|---|---|
2.439 ± 0.047 | 4.503 ± 0.064 |
4.933 ± 0.073 | 4.904 ± 0.078 |
4.928 ± 0.069 | 6.432 ± 0.078 |
5.731 ± 0.086 | 5.982 ± 0.066 |
1.277 ± 0.032 | 3.077 ± 0.048 |
Most of the basic statistics you can see at this page can be downloaded from this CSV file
Proteome-pI is available under Creative Commons Attribution-NoDerivs license, for more details see here
| Reference: Kozlowski LP. Proteome-pI 2.0: Proteome Isoelectric Point Database Update. Nucleic Acids Res. 2021, doi: 10.1093/nar/gkab944 | Contact: Lukasz P. Kozlowski |
