Sediminitomix flava
Taxonomy: cellular organisms; Bacteria; FCB group; Bacteroidetes/Chlorobi group; Bacteroidetes; Cytophagia; Cytophagales; Flammeovirgaceae; Sediminitomix
Average proteome isoelectric point is 6.03
Get precalculated fractions of proteins

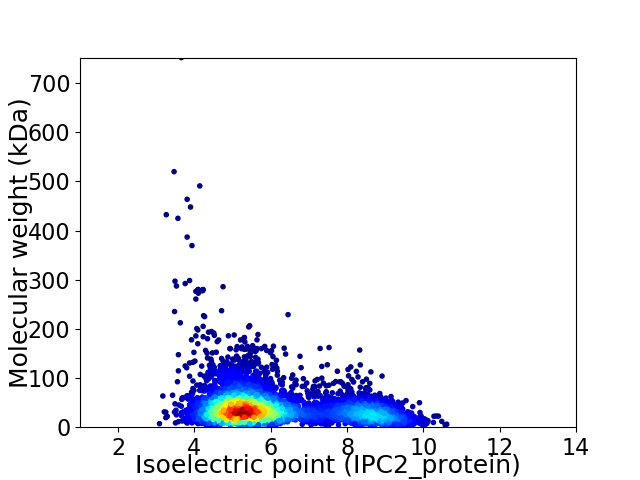
Virtual 2D-PAGE plot for 5031 proteins (isoelectric point calculated using IPC2_protein)
Get csv file with sequences according to given criteria:
* You can choose from 21 different methods for calculating isoelectric point
Summary statistics related to proteome-wise predictions


Protein with the lowest isoelectric point:
>tr|A0A315ZA28|A0A315ZA28_9BACT 4Fe-4S binding protein OS=Sediminitomix flava OX=379075 GN=BC781_103382 PE=4 SV=1
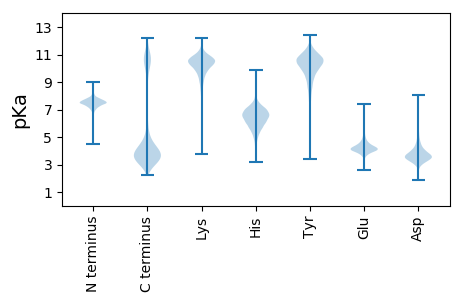
MM1 pKa = 7.49LRR3 pKa = 11.84NKK5 pKa = 10.23QIVLPAITIFFLLLISFNYY24 pKa = 9.88PNTFNFNTSLDD35 pKa = 3.74RR36 pKa = 11.84DD37 pKa = 3.52ADD39 pKa = 4.49GITDD43 pKa = 3.43KK44 pKa = 11.1RR45 pKa = 11.84DD46 pKa = 3.51YY47 pKa = 11.04CPLEE51 pKa = 4.76AGFISTGGCPDD62 pKa = 3.34IDD64 pKa = 4.43LDD66 pKa = 4.61GVADD70 pKa = 3.93KK71 pKa = 10.39WDD73 pKa = 3.73KK74 pKa = 11.28CPEE77 pKa = 4.24LEE79 pKa = 5.02GSLDD83 pKa = 3.81SFGCPDD89 pKa = 3.58YY90 pKa = 11.63DD91 pKa = 4.17KK92 pKa = 11.42DD93 pKa = 4.21GVSDD97 pKa = 4.0TVDD100 pKa = 2.94QCPYY104 pKa = 11.32DD105 pKa = 3.81FGEE108 pKa = 4.74AKK110 pKa = 10.89NNGCPDD116 pKa = 4.03LDD118 pKa = 3.57QDD120 pKa = 4.66GVADD124 pKa = 5.29HH125 pKa = 7.09MDD127 pKa = 3.45DD128 pKa = 5.52CIDD131 pKa = 3.46EE132 pKa = 4.57KK133 pKa = 11.26GTVEE137 pKa = 4.56TNGCPDD143 pKa = 3.35TDD145 pKa = 3.69KK146 pKa = 11.7DD147 pKa = 4.09GVADD151 pKa = 5.06IYY153 pKa = 11.13DD154 pKa = 3.71KK155 pKa = 11.45CPTKK159 pKa = 10.61FGEE162 pKa = 4.15VKK164 pKa = 10.28YY165 pKa = 9.68WGCIDD170 pKa = 4.14SDD172 pKa = 3.89GDD174 pKa = 4.18LVGDD178 pKa = 5.4HH179 pKa = 7.13IDD181 pKa = 3.31EE182 pKa = 4.57CPYY185 pKa = 11.54DD186 pKa = 4.17KK187 pKa = 11.28GSTLNKK193 pKa = 9.27GCPVKK198 pKa = 10.84
MM1 pKa = 7.49LRR3 pKa = 11.84NKK5 pKa = 10.23QIVLPAITIFFLLLISFNYY24 pKa = 9.88PNTFNFNTSLDD35 pKa = 3.74RR36 pKa = 11.84DD37 pKa = 3.52ADD39 pKa = 4.49GITDD43 pKa = 3.43KK44 pKa = 11.1RR45 pKa = 11.84DD46 pKa = 3.51YY47 pKa = 11.04CPLEE51 pKa = 4.76AGFISTGGCPDD62 pKa = 3.34IDD64 pKa = 4.43LDD66 pKa = 4.61GVADD70 pKa = 3.93KK71 pKa = 10.39WDD73 pKa = 3.73KK74 pKa = 11.28CPEE77 pKa = 4.24LEE79 pKa = 5.02GSLDD83 pKa = 3.81SFGCPDD89 pKa = 3.58YY90 pKa = 11.63DD91 pKa = 4.17KK92 pKa = 11.42DD93 pKa = 4.21GVSDD97 pKa = 4.0TVDD100 pKa = 2.94QCPYY104 pKa = 11.32DD105 pKa = 3.81FGEE108 pKa = 4.74AKK110 pKa = 10.89NNGCPDD116 pKa = 4.03LDD118 pKa = 3.57QDD120 pKa = 4.66GVADD124 pKa = 5.29HH125 pKa = 7.09MDD127 pKa = 3.45DD128 pKa = 5.52CIDD131 pKa = 3.46EE132 pKa = 4.57KK133 pKa = 11.26GTVEE137 pKa = 4.56TNGCPDD143 pKa = 3.35TDD145 pKa = 3.69KK146 pKa = 11.7DD147 pKa = 4.09GVADD151 pKa = 5.06IYY153 pKa = 11.13DD154 pKa = 3.71KK155 pKa = 11.45CPTKK159 pKa = 10.61FGEE162 pKa = 4.15VKK164 pKa = 10.28YY165 pKa = 9.68WGCIDD170 pKa = 4.14SDD172 pKa = 3.89GDD174 pKa = 4.18LVGDD178 pKa = 5.4HH179 pKa = 7.13IDD181 pKa = 3.31EE182 pKa = 4.57CPYY185 pKa = 11.54DD186 pKa = 4.17KK187 pKa = 11.28GSTLNKK193 pKa = 9.27GCPVKK198 pKa = 10.84
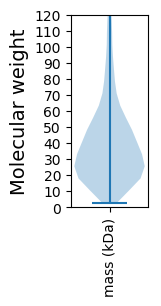
Molecular weight: 21.69 kDa
Isoelectric point according different methods:
Protein with the highest isoelectric point:
>tr|A0A315ZGC4|A0A315ZGC4_9BACT LuxR family two component transcriptional regulator OS=Sediminitomix flava OX=379075 GN=BC781_101732 PE=4 SV=1
MM1 pKa = 7.6KK2 pKa = 10.55FFLTRR7 pKa = 11.84IAPISLLAFIAQMIFPWWGVIAVCSFIYY35 pKa = 10.03TLFMPPHH42 pKa = 6.62SGWQAFFMGFFALLLLWGSAASVIDD67 pKa = 3.55IQNEE71 pKa = 4.53GILSKK76 pKa = 10.39RR77 pKa = 11.84IAMILQLPRR86 pKa = 11.84SVYY89 pKa = 10.48LVALTAFLGGLIAGLSSLSGFHH111 pKa = 6.21FRR113 pKa = 11.84RR114 pKa = 11.84MLSII118 pKa = 4.23
MM1 pKa = 7.6KK2 pKa = 10.55FFLTRR7 pKa = 11.84IAPISLLAFIAQMIFPWWGVIAVCSFIYY35 pKa = 10.03TLFMPPHH42 pKa = 6.62SGWQAFFMGFFALLLLWGSAASVIDD67 pKa = 3.55IQNEE71 pKa = 4.53GILSKK76 pKa = 10.39RR77 pKa = 11.84IAMILQLPRR86 pKa = 11.84SVYY89 pKa = 10.48LVALTAFLGGLIAGLSSLSGFHH111 pKa = 6.21FRR113 pKa = 11.84RR114 pKa = 11.84MLSII118 pKa = 4.23
Molecular weight: 13.19 kDa
Isoelectric point according different methods:
Peptides (in silico digests for buttom-up proteomics)
Below you can find in silico digests of the whole proteome with Trypsin, Chymotrypsin, Trypsin+LysC, LysN, ArgC proteases suitable for different mass spec machines.| Try ESI |
 |
|---|
| ChTry ESI |
 |
|---|
| ArgC ESI |
 |
|---|
| LysN ESI |
 |
|---|
| TryLysC ESI |
 |
|---|
| Try MALDI |
 |
|---|
| ChTry MALDI |
 |
|---|
| ArgC MALDI |
 |
|---|
| LysN MALDI |
 |
|---|
| TryLysC MALDI |
 |
|---|
| Try LTQ |
 |
|---|
| ChTry LTQ |
 |
|---|
| ArgC LTQ |
 |
|---|
| LysN LTQ |
 |
|---|
| TryLysC LTQ |
 |
|---|
| Try MSlow |
 |
|---|
| ChTry MSlow |
 |
|---|
| ArgC MSlow |
 |
|---|
| LysN MSlow |
 |
|---|
| TryLysC MSlow |
 |
|---|
| Try MShigh |
 |
|---|
| ChTry MShigh |
 |
|---|
| ArgC MShigh |
 |
|---|
| LysN MShigh |
 |
|---|
| TryLysC MShigh |
 |
|---|
General Statistics
Number of major isoforms |
Number of additional isoforms |
Number of all proteins |
Number of amino acids |
Min. Seq. Length |
Max. Seq. Length |
Avg. Seq. Length |
Avg. Mol. Weight |
|---|---|---|---|---|---|---|---|
0 |
1924432 |
24 |
6844 |
382.5 |
43.25 |
Amino acid frequency
Ala |
Cys |
Asp |
Glu |
Phe |
Gly |
His |
Ile |
Lys |
Leu |
|---|---|---|---|---|---|---|---|---|---|
6.205 ± 0.038 | 0.755 ± 0.013 |
5.762 ± 0.04 | 7.427 ± 0.033 |
5.195 ± 0.026 | 6.542 ± 0.039 |
1.876 ± 0.019 | 7.238 ± 0.028 |
7.089 ± 0.06 | 9.394 ± 0.042 |
Met |
Asn |
Gln |
Pro |
Arg |
Ser |
Thr |
Val |
Trp |
Tyr |
|---|---|---|---|---|---|---|---|---|---|
2.294 ± 0.019 | 5.52 ± 0.03 |
3.369 ± 0.018 | 3.686 ± 0.022 |
3.504 ± 0.026 | 6.943 ± 0.041 |
5.479 ± 0.044 | 6.263 ± 0.031 |
1.227 ± 0.014 | 4.233 ± 0.022 |
Most of the basic statistics you can see at this page can be downloaded from this CSV file
Proteome-pI is available under Creative Commons Attribution-NoDerivs license, for more details see here
| Reference: Kozlowski LP. Proteome-pI 2.0: Proteome Isoelectric Point Database Update. Nucleic Acids Res. 2021, doi: 10.1093/nar/gkab944 | Contact: Lukasz P. Kozlowski |
