Zygosaccharomyces rouxii (strain ATCC 2623 / CBS 732 / NBRC 1130 / NCYC 568 / NRRL Y-229) (Candida mogii)
Taxonomy: cellular organisms; Eukaryota; Opisthokonta; Fungi; Dikarya; Ascomycota; saccharomyceta; Saccharomycotina; Saccharomycetes; Saccharomycetales; Saccharomycetaceae; Zygosaccharomyces; Zygosaccharomyces rouxii
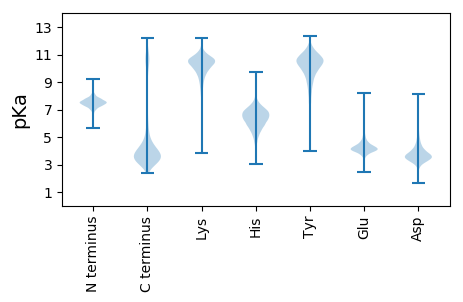
Average proteome isoelectric point is 6.41
Get precalculated fractions of proteins

Virtual 2D-PAGE plot for 4987 proteins (isoelectric point calculated using IPC2_protein)
Get csv file with sequences according to given criteria:
* You can choose from 21 different methods for calculating isoelectric point
Summary statistics related to proteome-wise predictions


Protein with the lowest isoelectric point:
>tr|C5E051|C5E051_ZYGRC Methionyl-tRNA formyltransferase mitochondrial OS=Zygosaccharomyces rouxii (strain ATCC 2623 / CBS 732 / NBRC 1130 / NCYC 568 / NRRL Y-229) OX=559307 GN=ZYRO0G09812g PE=3 SV=1
MM1 pKa = 7.53SAFNDD6 pKa = 3.73FCIVCDD12 pKa = 3.61QLIPQDD18 pKa = 4.03SLPPRR23 pKa = 11.84VDD25 pKa = 3.11EE26 pKa = 5.36LLYY29 pKa = 10.91CSEE32 pKa = 4.02EE33 pKa = 4.53CMVKK37 pKa = 9.48DD38 pKa = 4.06TSRR41 pKa = 11.84VPPAAAPAEE50 pKa = 4.15LSEE53 pKa = 4.56SASSLGDD60 pKa = 3.28VDD62 pKa = 5.45SLIASPLLLPMDD74 pKa = 4.08GMVPPPASGIEE85 pKa = 4.04DD86 pKa = 3.7SDD88 pKa = 4.13YY89 pKa = 10.89MLMEE93 pKa = 5.13LEE95 pKa = 4.61SASQAVPRR103 pKa = 11.84TQAVKK108 pKa = 10.23EE109 pKa = 4.16PCSPGAGNAVQVLDD123 pKa = 5.19RR124 pKa = 11.84VAEE127 pKa = 4.2DD128 pKa = 4.41NYY130 pKa = 11.25KK131 pKa = 10.6LWLSQCHH138 pKa = 4.84WW139 pKa = 3.86
MM1 pKa = 7.53SAFNDD6 pKa = 3.73FCIVCDD12 pKa = 3.61QLIPQDD18 pKa = 4.03SLPPRR23 pKa = 11.84VDD25 pKa = 3.11EE26 pKa = 5.36LLYY29 pKa = 10.91CSEE32 pKa = 4.02EE33 pKa = 4.53CMVKK37 pKa = 9.48DD38 pKa = 4.06TSRR41 pKa = 11.84VPPAAAPAEE50 pKa = 4.15LSEE53 pKa = 4.56SASSLGDD60 pKa = 3.28VDD62 pKa = 5.45SLIASPLLLPMDD74 pKa = 4.08GMVPPPASGIEE85 pKa = 4.04DD86 pKa = 3.7SDD88 pKa = 4.13YY89 pKa = 10.89MLMEE93 pKa = 5.13LEE95 pKa = 4.61SASQAVPRR103 pKa = 11.84TQAVKK108 pKa = 10.23EE109 pKa = 4.16PCSPGAGNAVQVLDD123 pKa = 5.19RR124 pKa = 11.84VAEE127 pKa = 4.2DD128 pKa = 4.41NYY130 pKa = 11.25KK131 pKa = 10.6LWLSQCHH138 pKa = 4.84WW139 pKa = 3.86
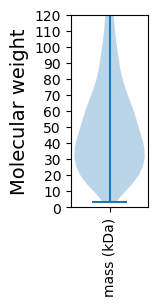
Molecular weight: 14.99 kDa
Isoelectric point according different methods:
Protein with the highest isoelectric point:
>tr|C5DSX2|C5DSX2_ZYGRC ZYRO0C03674p OS=Zygosaccharomyces rouxii (strain ATCC 2623 / CBS 732 / NBRC 1130 / NCYC 568 / NRRL Y-229) OX=559307 GN=ZYRO0C03674g PE=4 SV=1
MM1 pKa = 7.6WSFARR6 pKa = 11.84NIFQVGARR14 pKa = 11.84RR15 pKa = 11.84SLFTMGNWTPTTVSPLQRR33 pKa = 11.84LLGPSPLSSGFGMGQRR49 pKa = 11.84RR50 pKa = 11.84WKK52 pKa = 10.77SRR54 pKa = 11.84GNTFQPSTLKK64 pKa = 10.3RR65 pKa = 11.84KK66 pKa = 9.59RR67 pKa = 11.84RR68 pKa = 11.84VGFLARR74 pKa = 11.84ARR76 pKa = 11.84SKK78 pKa = 10.66QGSKK82 pKa = 9.49ILQRR86 pKa = 11.84RR87 pKa = 11.84KK88 pKa = 10.2HH89 pKa = 5.52KK90 pKa = 10.63GRR92 pKa = 11.84WFLTHH97 pKa = 7.07
MM1 pKa = 7.6WSFARR6 pKa = 11.84NIFQVGARR14 pKa = 11.84RR15 pKa = 11.84SLFTMGNWTPTTVSPLQRR33 pKa = 11.84LLGPSPLSSGFGMGQRR49 pKa = 11.84RR50 pKa = 11.84WKK52 pKa = 10.77SRR54 pKa = 11.84GNTFQPSTLKK64 pKa = 10.3RR65 pKa = 11.84KK66 pKa = 9.59RR67 pKa = 11.84RR68 pKa = 11.84VGFLARR74 pKa = 11.84ARR76 pKa = 11.84SKK78 pKa = 10.66QGSKK82 pKa = 9.49ILQRR86 pKa = 11.84RR87 pKa = 11.84KK88 pKa = 10.2HH89 pKa = 5.52KK90 pKa = 10.63GRR92 pKa = 11.84WFLTHH97 pKa = 7.07
Molecular weight: 11.27 kDa
Isoelectric point according different methods:
Peptides (in silico digests for buttom-up proteomics)
Below you can find in silico digests of the whole proteome with Trypsin, Chymotrypsin, Trypsin+LysC, LysN, ArgC proteases suitable for different mass spec machines.| Try ESI |
 |
|---|
| ChTry ESI |
 |
|---|
| ArgC ESI |
 |
|---|
| LysN ESI |
 |
|---|
| TryLysC ESI |
 |
|---|
| Try MALDI |
 |
|---|
| ChTry MALDI |
 |
|---|
| ArgC MALDI |
 |
|---|
| LysN MALDI |
 |
|---|
| TryLysC MALDI |
 |
|---|
| Try LTQ |
 |
|---|
| ChTry LTQ |
 |
|---|
| ArgC LTQ |
 |
|---|
| LysN LTQ |
 |
|---|
| TryLysC LTQ |
 |
|---|
| Try MSlow |
 |
|---|
| ChTry MSlow |
 |
|---|
| ArgC MSlow |
 |
|---|
| LysN MSlow |
 |
|---|
| TryLysC MSlow |
 |
|---|
| Try MShigh |
 |
|---|
| ChTry MShigh |
 |
|---|
| ArgC MShigh |
 |
|---|
| LysN MShigh |
 |
|---|
| TryLysC MShigh |
 |
|---|
General Statistics
Number of major isoforms |
Number of additional isoforms |
Number of all proteins |
Number of amino acids |
Min. Seq. Length |
Max. Seq. Length |
Avg. Seq. Length |
Avg. Mol. Weight |
|---|---|---|---|---|---|---|---|
0 |
2475090 |
25 |
4926 |
496.3 |
55.96 |
Amino acid frequency
Ala |
Cys |
Asp |
Glu |
Phe |
Gly |
His |
Ile |
Lys |
Leu |
|---|---|---|---|---|---|---|---|---|---|
5.839 ± 0.029 | 1.235 ± 0.015 |
5.92 ± 0.029 | 6.819 ± 0.038 |
4.327 ± 0.02 | 5.67 ± 0.039 |
2.234 ± 0.013 | 5.628 ± 0.022 |
6.675 ± 0.034 | 9.616 ± 0.044 |
Met |
Asn |
Gln |
Pro |
Arg |
Ser |
Thr |
Val |
Trp |
Tyr |
|---|---|---|---|---|---|---|---|---|---|
2.091 ± 0.013 | 5.368 ± 0.024 |
4.722 ± 0.031 | 4.488 ± 0.031 |
4.873 ± 0.023 | 8.681 ± 0.058 |
5.423 ± 0.031 | 6.028 ± 0.025 |
1.107 ± 0.011 | 3.255 ± 0.019 |
Most of the basic statistics you can see at this page can be downloaded from this CSV file
Proteome-pI is available under Creative Commons Attribution-NoDerivs license, for more details see here
| Reference: Kozlowski LP. Proteome-pI 2.0: Proteome Isoelectric Point Database Update. Nucleic Acids Res. 2021, doi: 10.1093/nar/gkab944 | Contact: Lukasz P. Kozlowski |
