Roseburia phage Jekyll
Taxonomy: Viruses; unclassified bacterial viruses
Average proteome isoelectric point is 5.9
Get precalculated fractions of proteins

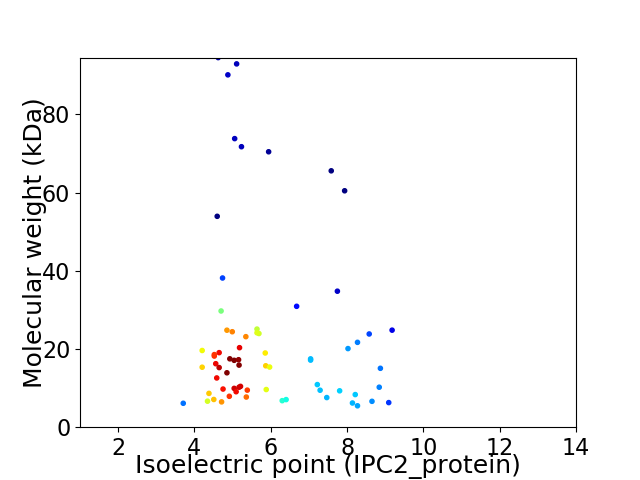
Virtual 2D-PAGE plot for 69 proteins (isoelectric point calculated using IPC2_protein)
Get csv file with sequences according to given criteria:
* You can choose from 21 different methods for calculating isoelectric point
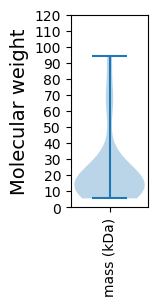
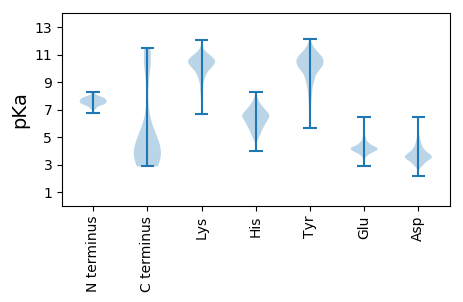
Summary statistics related to proteome-wise predictions


Protein with the lowest isoelectric point:
>tr|A0A509ENC9|A0A509ENC9_9VIRU Uncharacterized protein OS=Roseburia phage Jekyll OX=2570912 PE=4 SV=1
MM1 pKa = 7.66IKK3 pKa = 10.11KK4 pKa = 10.01QYY6 pKa = 10.5TSIDD10 pKa = 3.01WSDD13 pKa = 3.39YY14 pKa = 10.54DD15 pKa = 4.15SNNVVCMDD23 pKa = 4.07TNNSYY28 pKa = 8.22FTAEE32 pKa = 3.88LPEE35 pKa = 4.53DD36 pKa = 3.72EE37 pKa = 5.86RR38 pKa = 11.84EE39 pKa = 4.21LYY41 pKa = 10.98DD42 pKa = 3.42NAEE45 pKa = 4.23TVGIDD50 pKa = 3.37GTII53 pKa = 3.11
MM1 pKa = 7.66IKK3 pKa = 10.11KK4 pKa = 10.01QYY6 pKa = 10.5TSIDD10 pKa = 3.01WSDD13 pKa = 3.39YY14 pKa = 10.54DD15 pKa = 4.15SNNVVCMDD23 pKa = 4.07TNNSYY28 pKa = 8.22FTAEE32 pKa = 3.88LPEE35 pKa = 4.53DD36 pKa = 3.72EE37 pKa = 5.86RR38 pKa = 11.84EE39 pKa = 4.21LYY41 pKa = 10.98DD42 pKa = 3.42NAEE45 pKa = 4.23TVGIDD50 pKa = 3.37GTII53 pKa = 3.11
Molecular weight: 6.12 kDa
Isoelectric point according different methods:
Protein with the highest isoelectric point:
>tr|A0A509EQQ5|A0A509EQQ5_9VIRU Minor capsid protein OS=Roseburia phage Jekyll OX=2570912 PE=4 SV=1
MM1 pKa = 7.63ANRR4 pKa = 11.84RR5 pKa = 11.84IGQAGLALIKK15 pKa = 10.51QFEE18 pKa = 4.45SCRR21 pKa = 11.84LIAYY25 pKa = 7.54QCSAGVWTIGYY36 pKa = 8.21GHH38 pKa = 6.46TVGVYY43 pKa = 9.85KK44 pKa = 10.7GMKK47 pKa = 7.95ITQKK51 pKa = 10.59KK52 pKa = 9.31AEE54 pKa = 4.53AYY56 pKa = 10.32LLQDD60 pKa = 3.03VAKK63 pKa = 9.8FEE65 pKa = 4.72KK66 pKa = 10.74YY67 pKa = 10.03INNPSYY73 pKa = 11.66VPFTAQLNQNQFDD86 pKa = 4.22ALVSFAFNLGQGNVKK101 pKa = 9.97KK102 pKa = 10.55LCTGRR107 pKa = 11.84VMNQIPSAMQRR118 pKa = 11.84YY119 pKa = 8.47CKK121 pKa = 10.17AAGKK125 pKa = 7.27TLPGLQRR132 pKa = 11.84RR133 pKa = 11.84RR134 pKa = 11.84KK135 pKa = 10.2AEE137 pKa = 3.57AALYY141 pKa = 8.29NKK143 pKa = 9.92KK144 pKa = 10.27VEE146 pKa = 4.35SCTGATTTTVKK157 pKa = 10.51EE158 pKa = 4.25SEE160 pKa = 4.51DD161 pKa = 3.61YY162 pKa = 11.81SMNTIKK168 pKa = 10.62KK169 pKa = 8.06GSKK172 pKa = 9.65GNAVKK177 pKa = 10.31VWQIIIGTTADD188 pKa = 4.24GIFGSGTEE196 pKa = 4.22NMTKK200 pKa = 8.37TWQKK204 pKa = 10.37NHH206 pKa = 5.72GLMADD211 pKa = 4.45GIVGKK216 pKa = 10.18NSWKK220 pKa = 9.59TGLEE224 pKa = 4.15SLL226 pKa = 4.82
MM1 pKa = 7.63ANRR4 pKa = 11.84RR5 pKa = 11.84IGQAGLALIKK15 pKa = 10.51QFEE18 pKa = 4.45SCRR21 pKa = 11.84LIAYY25 pKa = 7.54QCSAGVWTIGYY36 pKa = 8.21GHH38 pKa = 6.46TVGVYY43 pKa = 9.85KK44 pKa = 10.7GMKK47 pKa = 7.95ITQKK51 pKa = 10.59KK52 pKa = 9.31AEE54 pKa = 4.53AYY56 pKa = 10.32LLQDD60 pKa = 3.03VAKK63 pKa = 9.8FEE65 pKa = 4.72KK66 pKa = 10.74YY67 pKa = 10.03INNPSYY73 pKa = 11.66VPFTAQLNQNQFDD86 pKa = 4.22ALVSFAFNLGQGNVKK101 pKa = 9.97KK102 pKa = 10.55LCTGRR107 pKa = 11.84VMNQIPSAMQRR118 pKa = 11.84YY119 pKa = 8.47CKK121 pKa = 10.17AAGKK125 pKa = 7.27TLPGLQRR132 pKa = 11.84RR133 pKa = 11.84RR134 pKa = 11.84KK135 pKa = 10.2AEE137 pKa = 3.57AALYY141 pKa = 8.29NKK143 pKa = 9.92KK144 pKa = 10.27VEE146 pKa = 4.35SCTGATTTTVKK157 pKa = 10.51EE158 pKa = 4.25SEE160 pKa = 4.51DD161 pKa = 3.61YY162 pKa = 11.81SMNTIKK168 pKa = 10.62KK169 pKa = 8.06GSKK172 pKa = 9.65GNAVKK177 pKa = 10.31VWQIIIGTTADD188 pKa = 4.24GIFGSGTEE196 pKa = 4.22NMTKK200 pKa = 8.37TWQKK204 pKa = 10.37NHH206 pKa = 5.72GLMADD211 pKa = 4.45GIVGKK216 pKa = 10.18NSWKK220 pKa = 9.59TGLEE224 pKa = 4.15SLL226 pKa = 4.82
Molecular weight: 24.81 kDa
Isoelectric point according different methods:
Peptides (in silico digests for buttom-up proteomics)
Below you can find in silico digests of the whole proteome with Trypsin, Chymotrypsin, Trypsin+LysC, LysN, ArgC proteases suitable for different mass spec machines.| Try ESI |
 |
|---|
| ChTry ESI |
 |
|---|
| ArgC ESI |
 |
|---|
| LysN ESI |
 |
|---|
| TryLysC ESI |
 |
|---|
| Try MALDI |
 |
|---|
| ChTry MALDI |
 |
|---|
| ArgC MALDI |
 |
|---|
| LysN MALDI |
 |
|---|
| TryLysC MALDI |
 |
|---|
| Try LTQ |
 |
|---|
| ChTry LTQ |
 |
|---|
| ArgC LTQ |
 |
|---|
| LysN LTQ |
 |
|---|
| TryLysC LTQ |
 |
|---|
| Try MSlow |
 |
|---|
| ChTry MSlow |
 |
|---|
| ArgC MSlow |
 |
|---|
| LysN MSlow |
 |
|---|
| TryLysC MSlow |
 |
|---|
| Try MShigh |
 |
|---|
| ChTry MShigh |
 |
|---|
| ArgC MShigh |
 |
|---|
| LysN MShigh |
 |
|---|
| TryLysC MShigh |
 |
|---|
General Statistics
Number of major isoforms |
Number of additional isoforms |
Number of all proteins |
Number of amino acids |
Min. Seq. Length |
Max. Seq. Length |
Avg. Seq. Length |
Avg. Mol. Weight |
|---|---|---|---|---|---|---|---|
0 |
14044 |
47 |
868 |
203.5 |
23.08 |
Amino acid frequency
Ala |
Cys |
Asp |
Glu |
Phe |
Gly |
His |
Ile |
Lys |
Leu |
|---|---|---|---|---|---|---|---|---|---|
6.487 ± 0.337 | 1.616 ± 0.161 |
6.551 ± 0.22 | 8.224 ± 0.363 |
3.817 ± 0.185 | 6.615 ± 0.295 |
1.716 ± 0.16 | 7.412 ± 0.33 |
8.196 ± 0.313 | 7.014 ± 0.255 |
Met |
Asn |
Gln |
Pro |
Arg |
Ser |
Thr |
Val |
Trp |
Tyr |
|---|---|---|---|---|---|---|---|---|---|
3.048 ± 0.156 | 5.461 ± 0.194 |
2.805 ± 0.228 | 3.596 ± 0.199 |
4.137 ± 0.307 | 6.152 ± 0.412 |
5.995 ± 0.284 | 5.654 ± 0.16 |
1.203 ± 0.11 | 4.301 ± 0.22 |
Most of the basic statistics you can see at this page can be downloaded from this CSV file
Proteome-pI is available under Creative Commons Attribution-NoDerivs license, for more details see here
| Reference: Kozlowski LP. Proteome-pI 2.0: Proteome Isoelectric Point Database Update. Nucleic Acids Res. 2021, doi: 10.1093/nar/gkab944 | Contact: Lukasz P. Kozlowski |
