Streptomyces sp. SID13588
Taxonomy: cellular organisms; Bacteria; Terrabacteria group; Actinobacteria; Actinomycetia; Streptomycetales; Streptomycetaceae; Streptomyces; unclassified Streptomyces
Average proteome isoelectric point is 6.4
Get precalculated fractions of proteins
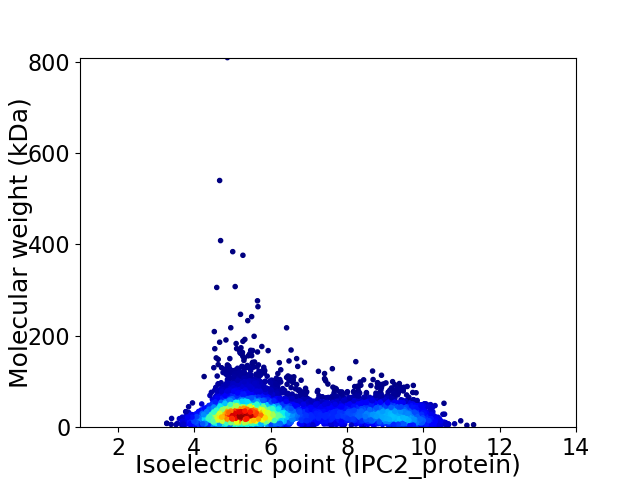
Virtual 2D-PAGE plot for 8348 proteins (isoelectric point calculated using IPC2_protein)
Get csv file with sequences according to given criteria:
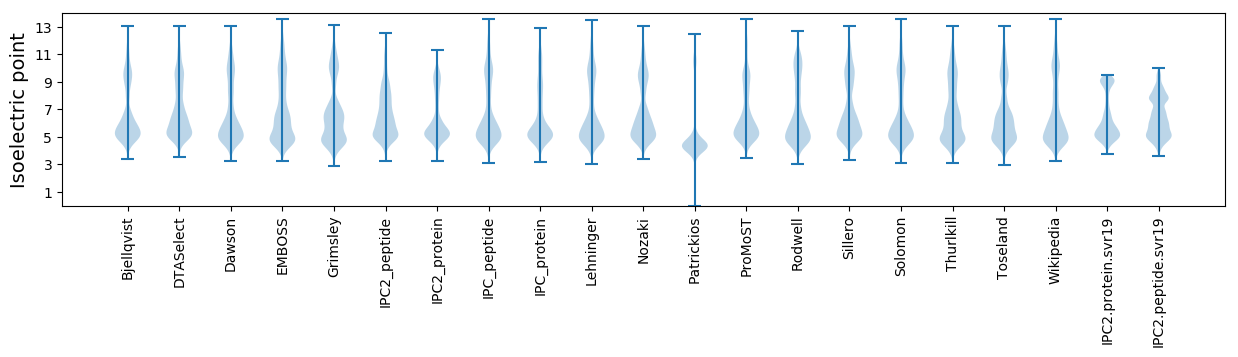
* You can choose from 21 different methods for calculating isoelectric point
Summary statistics related to proteome-wise predictions
Protein with the lowest isoelectric point:
>tr|A0A6B2WIU3|A0A6B2WIU3_9ACTN DUF192 domain-containing protein OS=Streptomyces sp. SID13588 OX=2706051 GN=G3I68_23540 PE=4 SV=1
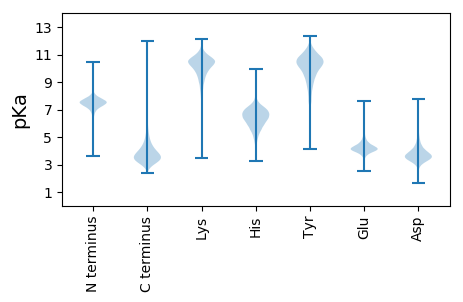
MM1 pKa = 6.97ITIVCHH7 pKa = 6.2CGDD10 pKa = 4.39NIGLPSGTEE19 pKa = 3.71TDD21 pKa = 3.34QDD23 pKa = 3.76DD24 pKa = 3.4GRR26 pKa = 11.84IYY28 pKa = 10.84HH29 pKa = 6.9GDD31 pKa = 3.32DD32 pKa = 3.49DD33 pKa = 4.92GRR35 pKa = 11.84PTACPLDD42 pKa = 4.01DD43 pKa = 4.41EE44 pKa = 5.06GEE46 pKa = 4.02IRR48 pKa = 11.84AA49 pKa = 4.31
MM1 pKa = 6.97ITIVCHH7 pKa = 6.2CGDD10 pKa = 4.39NIGLPSGTEE19 pKa = 3.71TDD21 pKa = 3.34QDD23 pKa = 3.76DD24 pKa = 3.4GRR26 pKa = 11.84IYY28 pKa = 10.84HH29 pKa = 6.9GDD31 pKa = 3.32DD32 pKa = 3.49DD33 pKa = 4.92GRR35 pKa = 11.84PTACPLDD42 pKa = 4.01DD43 pKa = 4.41EE44 pKa = 5.06GEE46 pKa = 4.02IRR48 pKa = 11.84AA49 pKa = 4.31
Molecular weight: 5.25 kDa
Isoelectric point according different methods:
Protein with the highest isoelectric point:
>tr|A0A6B2WK88|A0A6B2WK88_9ACTN Uncharacterized protein OS=Streptomyces sp. SID13588 OX=2706051 GN=G3I68_29905 PE=4 SV=1
MM1 pKa = 7.69SKK3 pKa = 9.0RR4 pKa = 11.84TFQPNNRR11 pKa = 11.84RR12 pKa = 11.84RR13 pKa = 11.84AKK15 pKa = 8.7THH17 pKa = 5.15GFRR20 pKa = 11.84LRR22 pKa = 11.84MRR24 pKa = 11.84TRR26 pKa = 11.84AGRR29 pKa = 11.84AILATRR35 pKa = 11.84RR36 pKa = 11.84VKK38 pKa = 10.66GRR40 pKa = 11.84ARR42 pKa = 11.84LSAA45 pKa = 3.91
MM1 pKa = 7.69SKK3 pKa = 9.0RR4 pKa = 11.84TFQPNNRR11 pKa = 11.84RR12 pKa = 11.84RR13 pKa = 11.84AKK15 pKa = 8.7THH17 pKa = 5.15GFRR20 pKa = 11.84LRR22 pKa = 11.84MRR24 pKa = 11.84TRR26 pKa = 11.84AGRR29 pKa = 11.84AILATRR35 pKa = 11.84RR36 pKa = 11.84VKK38 pKa = 10.66GRR40 pKa = 11.84ARR42 pKa = 11.84LSAA45 pKa = 3.91
Molecular weight: 5.31 kDa
Isoelectric point according different methods:
Peptides (in silico digests for buttom-up proteomics)
Below you can find in silico digests of the whole proteome with Trypsin, Chymotrypsin, Trypsin+LysC, LysN, ArgC proteases suitable for different mass spec machines.| Try ESI |
 |
|---|
| ChTry ESI |
|
|---|
| ArgC ESI |
|
|---|
| LysN ESI |
|
|---|
| TryLysC ESI |
|
|---|
| Try MALDI |
|
|---|
| ChTry MALDI |
|
|---|
| ArgC MALDI |
|
|---|
| LysN MALDI |
|
|---|
| TryLysC MALDI |
|
|---|
| Try LTQ |
|
|---|
| ChTry LTQ |
|
|---|
| ArgC LTQ |
|
|---|
| LysN LTQ |
|
|---|
| TryLysC LTQ |
|
|---|
| Try MSlow |
|
|---|
| ChTry MSlow |
|
|---|
| ArgC MSlow |
|
|---|
| LysN MSlow |
|
|---|
| TryLysC MSlow |
|
|---|
| Try MShigh |
|
|---|
| ChTry MShigh |
|
|---|
| ArgC MShigh |
|
|---|
| LysN MShigh |
|
|---|
| TryLysC MShigh |
|
|---|
General Statistics
Number of major isoforms |
Number of additional isoforms |
Number of all proteins |
Number of amino acids |
Min. Seq. Length |
Max. Seq. Length |
Avg. Seq. Length |
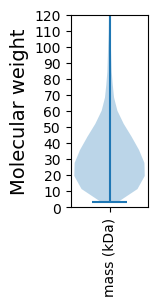
Avg. Mol. Weight |
|---|---|---|---|---|---|---|---|
0 |
2699635 |
29 |
7615 |
323.4 |
34.55 |
Amino acid frequency
Ala |
Cys |
Asp |
Glu |
Phe |
Gly |
His |
Ile |
Lys |
Leu |
|---|---|---|---|---|---|---|---|---|---|
13.583 ± 0.045 | 0.811 ± 0.008 |
5.938 ± 0.022 | 5.227 ± 0.026 |
2.765 ± 0.017 | 9.453 ± 0.029 |
2.302 ± 0.013 | 3.436 ± 0.019 |
2.126 ± 0.022 | 10.36 ± 0.034 |
Met |
Asn |
Gln |
Pro |
Arg |
Ser |
Thr |
Val |
Trp |
Tyr |
|---|---|---|---|---|---|---|---|---|---|
1.756 ± 0.01 | 1.948 ± 0.019 |
6.085 ± 0.023 | 2.942 ± 0.018 |
7.652 ± 0.029 | 5.34 ± 0.021 |
6.372 ± 0.033 | 8.244 ± 0.027 |
1.548 ± 0.011 | 2.114 ± 0.015 |
Most of the basic statistics you can see at this page can be downloaded from this CSV file
See this proteome in:

Proteome-pI is available under Creative Commons Attribution-NoDerivs license, for more details see here
| Reference: Kozlowski LP. Proteome-pI 2.0: Proteome Isoelectric Point Database Update. Nucleic Acids Res. 2021, doi: 10.1093/nar/gkab944 | Contact: Lukasz P. Kozlowski |