Sulfurihydrogenibium yellowstonense SS-5
Taxonomy: cellular organisms; Bacteria; Aquificae; Aquificae; Aquificales; Hydrogenothermaceae; Sulfurihydrogenibium; Sulfurihydrogenibium yellowstonense
Average proteome isoelectric point is 6.84
Get precalculated fractions of proteins

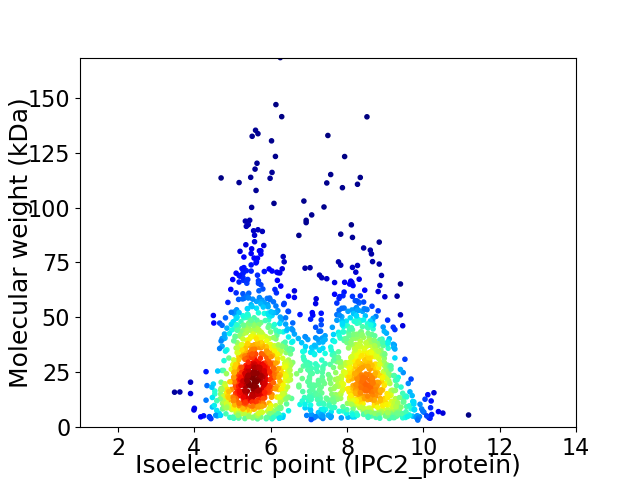
Virtual 2D-PAGE plot for 1670 proteins (isoelectric point calculated using IPC2_protein)
Get csv file with sequences according to given criteria:
* You can choose from 21 different methods for calculating isoelectric point
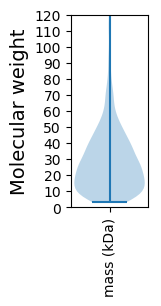
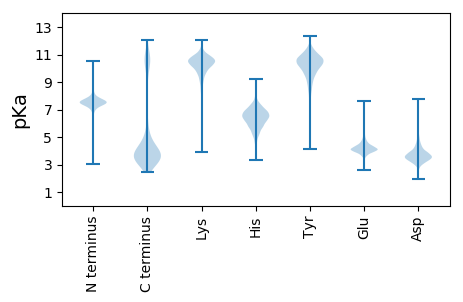
Summary statistics related to proteome-wise predictions


Protein with the lowest isoelectric point:
>tr|C4FID9|C4FID9_9AQUI Uncharacterized protein OS=Sulfurihydrogenibium yellowstonense SS-5 OX=432331 GN=SULYE_0324 PE=4 SV=1
MM1 pKa = 7.44EE2 pKa = 6.37LIIGLIALIAIILMIRR18 pKa = 11.84KK19 pKa = 9.46VGVIEE24 pKa = 4.05PNRR27 pKa = 11.84NVASNLQPLQNPQPSPTIQNIPQNTPSQNNSNALNDD63 pKa = 3.35ITKK66 pKa = 10.56AGLIGTATGLGLIGAGMLLNRR87 pKa = 11.84NNYY90 pKa = 7.86NYY92 pKa = 10.43YY93 pKa = 10.16YY94 pKa = 9.96PRR96 pKa = 11.84EE97 pKa = 4.22PDD99 pKa = 3.07TALAEE104 pKa = 4.25HH105 pKa = 6.49LHH107 pKa = 6.05DD108 pKa = 6.52LIWHH112 pKa = 7.04DD113 pKa = 5.56DD114 pKa = 3.82CNKK117 pKa = 10.01CDD119 pKa = 3.88NDD121 pKa = 3.78VIYY124 pKa = 8.99NTFSSCDD131 pKa = 3.31DD132 pKa = 3.53TGFDD136 pKa = 4.65SSNSSCSSSWDD147 pKa = 3.45DD148 pKa = 4.2NYY150 pKa = 11.7DD151 pKa = 3.77NNHH154 pKa = 6.67HH155 pKa = 7.57DD156 pKa = 6.06DD157 pKa = 4.53GYY159 pKa = 11.68SWNSWDD165 pKa = 4.93SNDD168 pKa = 5.96DD169 pKa = 3.85GYY171 pKa = 11.99SWNSWDD177 pKa = 5.26SGDD180 pKa = 4.25DD181 pKa = 3.8SSWW184 pKa = 2.97
MM1 pKa = 7.44EE2 pKa = 6.37LIIGLIALIAIILMIRR18 pKa = 11.84KK19 pKa = 9.46VGVIEE24 pKa = 4.05PNRR27 pKa = 11.84NVASNLQPLQNPQPSPTIQNIPQNTPSQNNSNALNDD63 pKa = 3.35ITKK66 pKa = 10.56AGLIGTATGLGLIGAGMLLNRR87 pKa = 11.84NNYY90 pKa = 7.86NYY92 pKa = 10.43YY93 pKa = 10.16YY94 pKa = 9.96PRR96 pKa = 11.84EE97 pKa = 4.22PDD99 pKa = 3.07TALAEE104 pKa = 4.25HH105 pKa = 6.49LHH107 pKa = 6.05DD108 pKa = 6.52LIWHH112 pKa = 7.04DD113 pKa = 5.56DD114 pKa = 3.82CNKK117 pKa = 10.01CDD119 pKa = 3.88NDD121 pKa = 3.78VIYY124 pKa = 8.99NTFSSCDD131 pKa = 3.31DD132 pKa = 3.53TGFDD136 pKa = 4.65SSNSSCSSSWDD147 pKa = 3.45DD148 pKa = 4.2NYY150 pKa = 11.7DD151 pKa = 3.77NNHH154 pKa = 6.67HH155 pKa = 7.57DD156 pKa = 6.06DD157 pKa = 4.53GYY159 pKa = 11.68SWNSWDD165 pKa = 4.93SNDD168 pKa = 5.96DD169 pKa = 3.85GYY171 pKa = 11.99SWNSWDD177 pKa = 5.26SGDD180 pKa = 4.25DD181 pKa = 3.8SSWW184 pKa = 2.97
Molecular weight: 20.49 kDa
Isoelectric point according different methods:
Protein with the highest isoelectric point:
>tr|C4FLK4|C4FLK4_9AQUI 3-dehydroquinate dehydratase OS=Sulfurihydrogenibium yellowstonense SS-5 OX=432331 GN=aroD PE=3 SV=1
MM1 pKa = 7.71ANMKK5 pKa = 10.3AKK7 pKa = 10.35SHH9 pKa = 6.63LSNKK13 pKa = 8.37KK14 pKa = 9.46RR15 pKa = 11.84KK16 pKa = 7.99RR17 pKa = 11.84TSGFLARR24 pKa = 11.84MKK26 pKa = 9.95TKK28 pKa = 10.54AGRR31 pKa = 11.84KK32 pKa = 7.59ILARR36 pKa = 11.84RR37 pKa = 11.84RR38 pKa = 11.84AKK40 pKa = 9.7GRR42 pKa = 11.84KK43 pKa = 9.06RR44 pKa = 11.84IAIKK48 pKa = 10.57
MM1 pKa = 7.71ANMKK5 pKa = 10.3AKK7 pKa = 10.35SHH9 pKa = 6.63LSNKK13 pKa = 8.37KK14 pKa = 9.46RR15 pKa = 11.84KK16 pKa = 7.99RR17 pKa = 11.84TSGFLARR24 pKa = 11.84MKK26 pKa = 9.95TKK28 pKa = 10.54AGRR31 pKa = 11.84KK32 pKa = 7.59ILARR36 pKa = 11.84RR37 pKa = 11.84RR38 pKa = 11.84AKK40 pKa = 9.7GRR42 pKa = 11.84KK43 pKa = 9.06RR44 pKa = 11.84IAIKK48 pKa = 10.57
Molecular weight: 5.55 kDa
Isoelectric point according different methods:
Peptides (in silico digests for buttom-up proteomics)
Below you can find in silico digests of the whole proteome with Trypsin, Chymotrypsin, Trypsin+LysC, LysN, ArgC proteases suitable for different mass spec machines.| Try ESI |
 |
|---|
| ChTry ESI |
 |
|---|
| ArgC ESI |
 |
|---|
| LysN ESI |
 |
|---|
| TryLysC ESI |
 |
|---|
| Try MALDI |
 |
|---|
| ChTry MALDI |
 |
|---|
| ArgC MALDI |
 |
|---|
| LysN MALDI |
 |
|---|
| TryLysC MALDI |
 |
|---|
| Try LTQ |
 |
|---|
| ChTry LTQ |
 |
|---|
| ArgC LTQ |
 |
|---|
| LysN LTQ |
 |
|---|
| TryLysC LTQ |
 |
|---|
| Try MSlow |
 |
|---|
| ChTry MSlow |
 |
|---|
| ArgC MSlow |
 |
|---|
| LysN MSlow |
 |
|---|
| TryLysC MSlow |
 |
|---|
| Try MShigh |
 |
|---|
| ChTry MShigh |
 |
|---|
| ArgC MShigh |
 |
|---|
| LysN MShigh |
 |
|---|
| TryLysC MShigh |
 |
|---|
General Statistics
Number of major isoforms |
Number of additional isoforms |
Number of all proteins |
Number of amino acids |
Min. Seq. Length |
Max. Seq. Length |
Avg. Seq. Length |
Avg. Mol. Weight |
|---|---|---|---|---|---|---|---|
0 |
435704 |
29 |
1488 |
260.9 |
29.76 |
Amino acid frequency
Ala |
Cys |
Asp |
Glu |
Phe |
Gly |
His |
Ile |
Lys |
Leu |
|---|---|---|---|---|---|---|---|---|---|
5.656 ± 0.063 | 0.718 ± 0.02 |
5.347 ± 0.044 | 8.173 ± 0.076 |
4.997 ± 0.056 | 5.918 ± 0.059 |
1.454 ± 0.024 | 9.45 ± 0.062 |
10.038 ± 0.074 | 9.83 ± 0.055 |
Met |
Asn |
Gln |
Pro |
Arg |
Ser |
Thr |
Val |
Trp |
Tyr |
|---|---|---|---|---|---|---|---|---|---|
1.954 ± 0.029 | 5.188 ± 0.056 |
3.569 ± 0.037 | 2.597 ± 0.035 |
3.609 ± 0.042 | 5.462 ± 0.042 |
4.406 ± 0.041 | 6.481 ± 0.055 |
0.77 ± 0.021 | 4.382 ± 0.048 |
Most of the basic statistics you can see at this page can be downloaded from this CSV file
Proteome-pI is available under Creative Commons Attribution-NoDerivs license, for more details see here
| Reference: Kozlowski LP. Proteome-pI 2.0: Proteome Isoelectric Point Database Update. Nucleic Acids Res. 2021, doi: 10.1093/nar/gkab944 | Contact: Lukasz P. Kozlowski |
