Mucilaginibacter psychrotolerans
Taxonomy: cellular organisms; Bacteria; FCB group; Bacteroidetes/Chlorobi group; Bacteroidetes; Sphingobacteriia; Sphingobacteriales; Sphingobacteriaceae; Mucilaginibacter
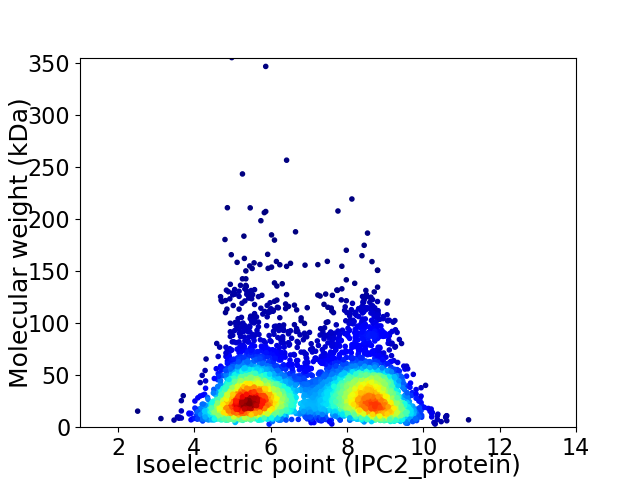
Average proteome isoelectric point is 6.92
Get precalculated fractions of proteins

Virtual 2D-PAGE plot for 5520 proteins (isoelectric point calculated using IPC2_protein)
Get csv file with sequences according to given criteria:
* You can choose from 21 different methods for calculating isoelectric point
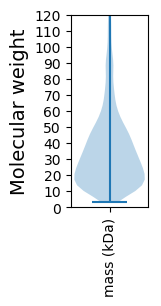
Summary statistics related to proteome-wise predictions


Protein with the lowest isoelectric point:
>tr|A0A4Y8SE64|A0A4Y8SE64_9SPHI DoxX family protein OS=Mucilaginibacter psychrotolerans OX=1524096 GN=E2R66_14150 PE=4 SV=1
MM1 pKa = 7.65FDD3 pKa = 5.22DD4 pKa = 6.21DD5 pKa = 6.15DD6 pKa = 4.72WDD8 pKa = 5.69DD9 pKa = 5.82DD10 pKa = 5.43DD11 pKa = 7.5DD12 pKa = 5.74DD13 pKa = 6.71LEE15 pKa = 6.39DD16 pKa = 3.78MLDD19 pKa = 3.91GEE21 pKa = 4.77EE22 pKa = 4.05ATNLQMLNLIKK33 pKa = 9.9KK34 pKa = 7.71TNEE37 pKa = 3.82TYY39 pKa = 10.73KK40 pKa = 10.74EE41 pKa = 4.19FIGNGYY47 pKa = 9.72QDD49 pKa = 4.14GNPVAGQPIGTGYY62 pKa = 8.69TLVDD66 pKa = 3.45KK67 pKa = 11.1EE68 pKa = 4.42EE69 pKa = 4.0NTLYY73 pKa = 9.69EE74 pKa = 4.25TFDD77 pKa = 3.54NDD79 pKa = 4.12AEE81 pKa = 4.16EE82 pKa = 5.9AEE84 pKa = 4.41FNLLKK89 pKa = 10.73QLVFDD94 pKa = 4.36DD95 pKa = 3.98QNYY98 pKa = 8.64EE99 pKa = 3.85QAIPQLLQAIEE110 pKa = 4.8KK111 pKa = 9.75YY112 pKa = 8.42PQRR115 pKa = 11.84EE116 pKa = 3.49QFYY119 pKa = 10.57FLLQFAYY126 pKa = 8.94THH128 pKa = 6.41NNQFDD133 pKa = 3.76EE134 pKa = 4.76SDD136 pKa = 3.83VILEE140 pKa = 3.86RR141 pKa = 11.84TYY143 pKa = 11.71NRR145 pKa = 11.84FPDD148 pKa = 4.14YY149 pKa = 10.73LPHH152 pKa = 6.93RR153 pKa = 11.84VDD155 pKa = 4.56FADD158 pKa = 3.31ILLDD162 pKa = 3.27QGRR165 pKa = 11.84NDD167 pKa = 4.19EE168 pKa = 4.33IPAVFDD174 pKa = 3.9NKK176 pKa = 10.97ADD178 pKa = 3.91LADD181 pKa = 4.19IYY183 pKa = 10.73PGQTEE188 pKa = 4.16FNIEE192 pKa = 3.77LAANYY197 pKa = 9.28YY198 pKa = 11.01GIMCRR203 pKa = 11.84YY204 pKa = 8.8YY205 pKa = 10.91SIIGDD210 pKa = 3.4IASADD215 pKa = 3.75RR216 pKa = 11.84YY217 pKa = 9.74MDD219 pKa = 3.82ALINEE224 pKa = 4.98DD225 pKa = 3.9YY226 pKa = 11.54NLITQYY232 pKa = 9.99GTTLLKK238 pKa = 10.4IPVYY242 pKa = 10.88GFLTAKK248 pKa = 10.2FEE250 pKa = 4.38AMNTGDD256 pKa = 3.77EE257 pKa = 4.23ALDD260 pKa = 3.77FF261 pKa = 4.86
MM1 pKa = 7.65FDD3 pKa = 5.22DD4 pKa = 6.21DD5 pKa = 6.15DD6 pKa = 4.72WDD8 pKa = 5.69DD9 pKa = 5.82DD10 pKa = 5.43DD11 pKa = 7.5DD12 pKa = 5.74DD13 pKa = 6.71LEE15 pKa = 6.39DD16 pKa = 3.78MLDD19 pKa = 3.91GEE21 pKa = 4.77EE22 pKa = 4.05ATNLQMLNLIKK33 pKa = 9.9KK34 pKa = 7.71TNEE37 pKa = 3.82TYY39 pKa = 10.73KK40 pKa = 10.74EE41 pKa = 4.19FIGNGYY47 pKa = 9.72QDD49 pKa = 4.14GNPVAGQPIGTGYY62 pKa = 8.69TLVDD66 pKa = 3.45KK67 pKa = 11.1EE68 pKa = 4.42EE69 pKa = 4.0NTLYY73 pKa = 9.69EE74 pKa = 4.25TFDD77 pKa = 3.54NDD79 pKa = 4.12AEE81 pKa = 4.16EE82 pKa = 5.9AEE84 pKa = 4.41FNLLKK89 pKa = 10.73QLVFDD94 pKa = 4.36DD95 pKa = 3.98QNYY98 pKa = 8.64EE99 pKa = 3.85QAIPQLLQAIEE110 pKa = 4.8KK111 pKa = 9.75YY112 pKa = 8.42PQRR115 pKa = 11.84EE116 pKa = 3.49QFYY119 pKa = 10.57FLLQFAYY126 pKa = 8.94THH128 pKa = 6.41NNQFDD133 pKa = 3.76EE134 pKa = 4.76SDD136 pKa = 3.83VILEE140 pKa = 3.86RR141 pKa = 11.84TYY143 pKa = 11.71NRR145 pKa = 11.84FPDD148 pKa = 4.14YY149 pKa = 10.73LPHH152 pKa = 6.93RR153 pKa = 11.84VDD155 pKa = 4.56FADD158 pKa = 3.31ILLDD162 pKa = 3.27QGRR165 pKa = 11.84NDD167 pKa = 4.19EE168 pKa = 4.33IPAVFDD174 pKa = 3.9NKK176 pKa = 10.97ADD178 pKa = 3.91LADD181 pKa = 4.19IYY183 pKa = 10.73PGQTEE188 pKa = 4.16FNIEE192 pKa = 3.77LAANYY197 pKa = 9.28YY198 pKa = 11.01GIMCRR203 pKa = 11.84YY204 pKa = 8.8YY205 pKa = 10.91SIIGDD210 pKa = 3.4IASADD215 pKa = 3.75RR216 pKa = 11.84YY217 pKa = 9.74MDD219 pKa = 3.82ALINEE224 pKa = 4.98DD225 pKa = 3.9YY226 pKa = 11.54NLITQYY232 pKa = 9.99GTTLLKK238 pKa = 10.4IPVYY242 pKa = 10.88GFLTAKK248 pKa = 10.2FEE250 pKa = 4.38AMNTGDD256 pKa = 3.77EE257 pKa = 4.23ALDD260 pKa = 3.77FF261 pKa = 4.86
Molecular weight: 30.28 kDa
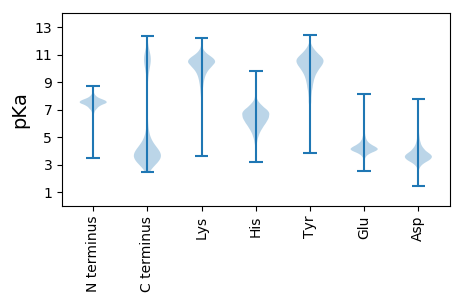
Isoelectric point according different methods:
Protein with the highest isoelectric point:
>tr|A0A4Y8SN46|A0A4Y8SN46_9SPHI TonB-dependent receptor OS=Mucilaginibacter psychrotolerans OX=1524096 GN=E2R66_02225 PE=4 SV=1
MM1 pKa = 7.51KK2 pKa = 10.42KK3 pKa = 9.71ILLSLAITISAIVAQAQTPIVVRR26 pKa = 11.84HH27 pKa = 4.71PRR29 pKa = 11.84QRR31 pKa = 11.84VVVLTRR37 pKa = 11.84PAVARR42 pKa = 11.84PVLVTRR48 pKa = 11.84PLIVRR53 pKa = 11.84PVRR56 pKa = 11.84RR57 pKa = 11.84RR58 pKa = 11.84VVIVHH63 pKa = 6.71
MM1 pKa = 7.51KK2 pKa = 10.42KK3 pKa = 9.71ILLSLAITISAIVAQAQTPIVVRR26 pKa = 11.84HH27 pKa = 4.71PRR29 pKa = 11.84QRR31 pKa = 11.84VVVLTRR37 pKa = 11.84PAVARR42 pKa = 11.84PVLVTRR48 pKa = 11.84PLIVRR53 pKa = 11.84PVRR56 pKa = 11.84RR57 pKa = 11.84RR58 pKa = 11.84VVIVHH63 pKa = 6.71
Molecular weight: 7.07 kDa
Isoelectric point according different methods:
Peptides (in silico digests for buttom-up proteomics)
Below you can find in silico digests of the whole proteome with Trypsin, Chymotrypsin, Trypsin+LysC, LysN, ArgC proteases suitable for different mass spec machines.| Try ESI |
 |
|---|
| ChTry ESI |
 |
|---|
| ArgC ESI |
 |
|---|
| LysN ESI |
 |
|---|
| TryLysC ESI |
 |
|---|
| Try MALDI |
 |
|---|
| ChTry MALDI |
 |
|---|
| ArgC MALDI |
 |
|---|
| LysN MALDI |
 |
|---|
| TryLysC MALDI |
 |
|---|
| Try LTQ |
 |
|---|
| ChTry LTQ |
 |
|---|
| ArgC LTQ |
 |
|---|
| LysN LTQ |
 |
|---|
| TryLysC LTQ |
 |
|---|
| Try MSlow |
 |
|---|
| ChTry MSlow |
 |
|---|
| ArgC MSlow |
 |
|---|
| LysN MSlow |
 |
|---|
| TryLysC MSlow |
 |
|---|
| Try MShigh |
 |
|---|
| ChTry MShigh |
 |
|---|
| ArgC MShigh |
 |
|---|
| LysN MShigh |
 |
|---|
| TryLysC MShigh |
 |
|---|
General Statistics
Number of major isoforms |
Number of additional isoforms |
Number of all proteins |
Number of amino acids |
Min. Seq. Length |
Max. Seq. Length |
Avg. Seq. Length |
Avg. Mol. Weight |
|---|---|---|---|---|---|---|---|
0 |
1844079 |
25 |
3573 |
334.1 |
37.35 |
Amino acid frequency
Ala |
Cys |
Asp |
Glu |
Phe |
Gly |
His |
Ile |
Lys |
Leu |
|---|---|---|---|---|---|---|---|---|---|
8.094 ± 0.034 | 0.803 ± 0.01 |
5.488 ± 0.023 | 5.229 ± 0.037 |
4.868 ± 0.024 | 6.926 ± 0.033 |
1.879 ± 0.017 | 7.057 ± 0.029 |
6.878 ± 0.024 | 9.54 ± 0.039 |
Met |
Asn |
Gln |
Pro |
Arg |
Ser |
Thr |
Val |
Trp |
Tyr |
|---|---|---|---|---|---|---|---|---|---|
2.274 ± 0.016 | 5.475 ± 0.034 |
3.976 ± 0.019 | 3.728 ± 0.02 |
3.936 ± 0.022 | 6.048 ± 0.03 |
5.918 ± 0.036 | 6.433 ± 0.025 |
1.203 ± 0.013 | 4.247 ± 0.025 |
Most of the basic statistics you can see at this page can be downloaded from this CSV file
Proteome-pI is available under Creative Commons Attribution-NoDerivs license, for more details see here
| Reference: Kozlowski LP. Proteome-pI 2.0: Proteome Isoelectric Point Database Update. Nucleic Acids Res. 2021, doi: 10.1093/nar/gkab944 | Contact: Lukasz P. Kozlowski |
