Trueperella bialowiezensis
Taxonomy: cellular organisms; Bacteria; Terrabacteria group; Actinobacteria; Actinomycetia; Actinomycetales; Actinomycetaceae; Trueperella
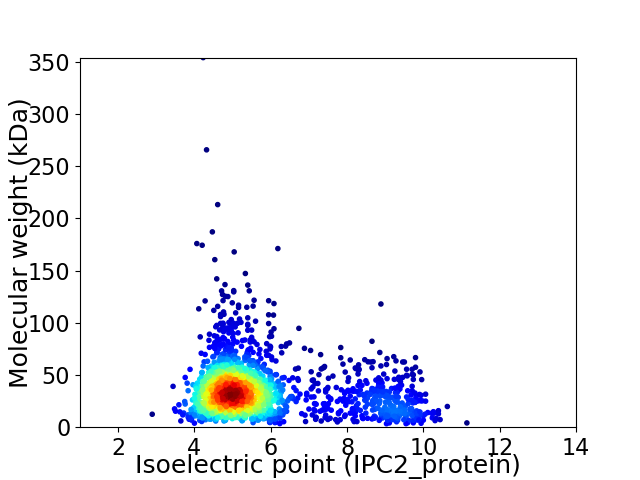
Average proteome isoelectric point is 5.85
Get precalculated fractions of proteins

Virtual 2D-PAGE plot for 1821 proteins (isoelectric point calculated using IPC2_protein)
Get csv file with sequences according to given criteria:
* You can choose from 21 different methods for calculating isoelectric point
Summary statistics related to proteome-wise predictions


Protein with the lowest isoelectric point:
>tr|A0A448PFB6|A0A448PFB6_9ACTO Probable ATP-dependent Clp protease ATP-binding subunit OS=Trueperella bialowiezensis OX=312285 GN=clpC PE=3 SV=1
MM1 pKa = 6.5TTATTRR7 pKa = 11.84KK8 pKa = 9.18RR9 pKa = 11.84QLALALILPVGLALAACEE27 pKa = 4.07SDD29 pKa = 3.22TTIGINEE36 pKa = 4.97DD37 pKa = 3.34GVASITMEE45 pKa = 3.59IHH47 pKa = 6.47DD48 pKa = 4.47TSGMLAAGGMTSCDD62 pKa = 3.42EE63 pKa = 4.35FSSSIAEE70 pKa = 4.26GDD72 pKa = 3.64DD73 pKa = 3.47SFTVEE78 pKa = 5.81DD79 pKa = 3.68ISKK82 pKa = 10.62DD83 pKa = 3.33GNLGCRR89 pKa = 11.84ITGNSGVSAVDD100 pKa = 3.48DD101 pKa = 4.18DD102 pKa = 4.77VLVEE106 pKa = 4.24TDD108 pKa = 3.16DD109 pKa = 4.04TYY111 pKa = 11.5IFTIDD116 pKa = 4.12EE117 pKa = 4.48DD118 pKa = 4.24LGDD121 pKa = 3.9TGLTDD126 pKa = 4.03EE127 pKa = 5.28DD128 pKa = 4.34LAMLKK133 pKa = 10.51QMGFGFSFTVEE144 pKa = 3.93MPGDD148 pKa = 3.45IVKK151 pKa = 10.66ADD153 pKa = 3.53GAQISGNRR161 pKa = 11.84ATFDD165 pKa = 3.75DD166 pKa = 4.76PSVFSQGITVEE177 pKa = 4.88GYY179 pKa = 10.27KK180 pKa = 10.35SGSGGGSKK188 pKa = 8.09PTPSPTATTEE198 pKa = 4.28GPEE201 pKa = 4.41TPTPTEE207 pKa = 4.63DD208 pKa = 3.59PTDD211 pKa = 3.81EE212 pKa = 4.42PTDD215 pKa = 3.84EE216 pKa = 4.24PTEE219 pKa = 4.23APTTNEE225 pKa = 4.32DD226 pKa = 3.31EE227 pKa = 5.46DD228 pKa = 4.27GGFPVWGWILIGVGALAVIGGVVFAVTRR256 pKa = 11.84KK257 pKa = 10.47KK258 pKa = 10.78NDD260 pKa = 3.11GDD262 pKa = 3.56NGGFGGPGYY271 pKa = 9.62PGGPGGPGYY280 pKa = 9.88PGGYY284 pKa = 8.9GQGGYY289 pKa = 9.92GQGGYY294 pKa = 9.92GQGGYY299 pKa = 9.88GQGGQPTQQFAPGQGAPGQGGYY321 pKa = 9.99GQGGYY326 pKa = 9.88GQGGQPTQQFAPTQPLPTGQANYY349 pKa = 9.7GHH351 pKa = 6.68SGHH354 pKa = 7.18PAPRR358 pKa = 11.84NPAGYY363 pKa = 9.58DD364 pKa = 3.22AAPNVPQSPGAQGAYY379 pKa = 9.67GQVGSQGGYY388 pKa = 8.8QSSGQSTPAASSFSRR403 pKa = 11.84GGAEE407 pKa = 3.95GGLNEE412 pKa = 4.65TGNMPKK418 pKa = 9.89QDD420 pKa = 3.26
MM1 pKa = 6.5TTATTRR7 pKa = 11.84KK8 pKa = 9.18RR9 pKa = 11.84QLALALILPVGLALAACEE27 pKa = 4.07SDD29 pKa = 3.22TTIGINEE36 pKa = 4.97DD37 pKa = 3.34GVASITMEE45 pKa = 3.59IHH47 pKa = 6.47DD48 pKa = 4.47TSGMLAAGGMTSCDD62 pKa = 3.42EE63 pKa = 4.35FSSSIAEE70 pKa = 4.26GDD72 pKa = 3.64DD73 pKa = 3.47SFTVEE78 pKa = 5.81DD79 pKa = 3.68ISKK82 pKa = 10.62DD83 pKa = 3.33GNLGCRR89 pKa = 11.84ITGNSGVSAVDD100 pKa = 3.48DD101 pKa = 4.18DD102 pKa = 4.77VLVEE106 pKa = 4.24TDD108 pKa = 3.16DD109 pKa = 4.04TYY111 pKa = 11.5IFTIDD116 pKa = 4.12EE117 pKa = 4.48DD118 pKa = 4.24LGDD121 pKa = 3.9TGLTDD126 pKa = 4.03EE127 pKa = 5.28DD128 pKa = 4.34LAMLKK133 pKa = 10.51QMGFGFSFTVEE144 pKa = 3.93MPGDD148 pKa = 3.45IVKK151 pKa = 10.66ADD153 pKa = 3.53GAQISGNRR161 pKa = 11.84ATFDD165 pKa = 3.75DD166 pKa = 4.76PSVFSQGITVEE177 pKa = 4.88GYY179 pKa = 10.27KK180 pKa = 10.35SGSGGGSKK188 pKa = 8.09PTPSPTATTEE198 pKa = 4.28GPEE201 pKa = 4.41TPTPTEE207 pKa = 4.63DD208 pKa = 3.59PTDD211 pKa = 3.81EE212 pKa = 4.42PTDD215 pKa = 3.84EE216 pKa = 4.24PTEE219 pKa = 4.23APTTNEE225 pKa = 4.32DD226 pKa = 3.31EE227 pKa = 5.46DD228 pKa = 4.27GGFPVWGWILIGVGALAVIGGVVFAVTRR256 pKa = 11.84KK257 pKa = 10.47KK258 pKa = 10.78NDD260 pKa = 3.11GDD262 pKa = 3.56NGGFGGPGYY271 pKa = 9.62PGGPGGPGYY280 pKa = 9.88PGGYY284 pKa = 8.9GQGGYY289 pKa = 9.92GQGGYY294 pKa = 9.92GQGGYY299 pKa = 9.88GQGGQPTQQFAPGQGAPGQGGYY321 pKa = 9.99GQGGYY326 pKa = 9.88GQGGQPTQQFAPTQPLPTGQANYY349 pKa = 9.7GHH351 pKa = 6.68SGHH354 pKa = 7.18PAPRR358 pKa = 11.84NPAGYY363 pKa = 9.58DD364 pKa = 3.22AAPNVPQSPGAQGAYY379 pKa = 9.67GQVGSQGGYY388 pKa = 8.8QSSGQSTPAASSFSRR403 pKa = 11.84GGAEE407 pKa = 3.95GGLNEE412 pKa = 4.65TGNMPKK418 pKa = 9.89QDD420 pKa = 3.26
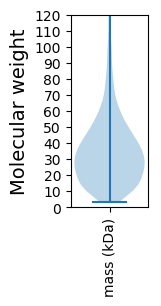
Molecular weight: 42.2 kDa
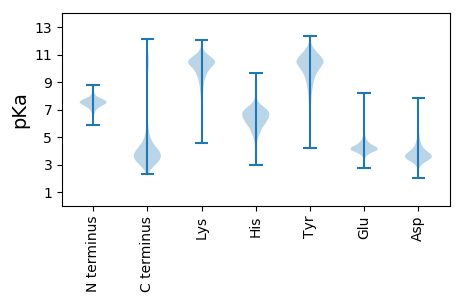
Isoelectric point according different methods:
Protein with the highest isoelectric point:
>tr|A0A448PFN7|A0A448PFN7_9ACTO ATP synthase subunit alpha OS=Trueperella bialowiezensis OX=312285 GN=atpA PE=3 SV=1
MM1 pKa = 7.4GSVIKK6 pKa = 10.38KK7 pKa = 8.42RR8 pKa = 11.84RR9 pKa = 11.84KK10 pKa = 9.06RR11 pKa = 11.84MSKK14 pKa = 9.76KK15 pKa = 9.54KK16 pKa = 9.79HH17 pKa = 5.67RR18 pKa = 11.84KK19 pKa = 8.31LLRR22 pKa = 11.84KK23 pKa = 7.78TRR25 pKa = 11.84HH26 pKa = 3.65QRR28 pKa = 11.84RR29 pKa = 11.84NKK31 pKa = 9.78KK32 pKa = 9.85
MM1 pKa = 7.4GSVIKK6 pKa = 10.38KK7 pKa = 8.42RR8 pKa = 11.84RR9 pKa = 11.84KK10 pKa = 9.06RR11 pKa = 11.84MSKK14 pKa = 9.76KK15 pKa = 9.54KK16 pKa = 9.79HH17 pKa = 5.67RR18 pKa = 11.84KK19 pKa = 8.31LLRR22 pKa = 11.84KK23 pKa = 7.78TRR25 pKa = 11.84HH26 pKa = 3.65QRR28 pKa = 11.84RR29 pKa = 11.84NKK31 pKa = 9.78KK32 pKa = 9.85
Molecular weight: 4.1 kDa
Isoelectric point according different methods:
Peptides (in silico digests for buttom-up proteomics)
Below you can find in silico digests of the whole proteome with Trypsin, Chymotrypsin, Trypsin+LysC, LysN, ArgC proteases suitable for different mass spec machines.| Try ESI |
 |
|---|
| ChTry ESI |
 |
|---|
| ArgC ESI |
 |
|---|
| LysN ESI |
 |
|---|
| TryLysC ESI |
 |
|---|
| Try MALDI |
 |
|---|
| ChTry MALDI |
 |
|---|
| ArgC MALDI |
 |
|---|
| LysN MALDI |
 |
|---|
| TryLysC MALDI |
 |
|---|
| Try LTQ |
 |
|---|
| ChTry LTQ |
 |
|---|
| ArgC LTQ |
 |
|---|
| LysN LTQ |
 |
|---|
| TryLysC LTQ |
 |
|---|
| Try MSlow |
 |
|---|
| ChTry MSlow |
 |
|---|
| ArgC MSlow |
 |
|---|
| LysN MSlow |
 |
|---|
| TryLysC MSlow |
 |
|---|
| Try MShigh |
 |
|---|
| ChTry MShigh |
 |
|---|
| ArgC MShigh |
 |
|---|
| LysN MShigh |
 |
|---|
| TryLysC MShigh |
 |
|---|
General Statistics
Number of major isoforms |
Number of additional isoforms |
Number of all proteins |
Number of amino acids |
Min. Seq. Length |
Max. Seq. Length |
Avg. Seq. Length |
Avg. Mol. Weight |
|---|---|---|---|---|---|---|---|
0 |
618937 |
29 |
3317 |
339.9 |
36.86 |
Amino acid frequency
Ala |
Cys |
Asp |
Glu |
Phe |
Gly |
His |
Ile |
Lys |
Leu |
|---|---|---|---|---|---|---|---|---|---|
11.666 ± 0.08 | 0.595 ± 0.014 |
6.375 ± 0.054 | 6.408 ± 0.063 |
3.182 ± 0.038 | 8.346 ± 0.047 |
2.085 ± 0.025 | 5.278 ± 0.05 |
3.255 ± 0.04 | 9.194 ± 0.064 |
Met |
Asn |
Gln |
Pro |
Arg |
Ser |
Thr |
Val |
Trp |
Tyr |
|---|---|---|---|---|---|---|---|---|---|
2.231 ± 0.028 | 2.858 ± 0.03 |
5.1 ± 0.049 | 3.289 ± 0.031 |
6.357 ± 0.057 | 5.664 ± 0.041 |
5.952 ± 0.051 | 8.395 ± 0.044 |
1.373 ± 0.024 | 2.397 ± 0.03 |
Most of the basic statistics you can see at this page can be downloaded from this CSV file
Proteome-pI is available under Creative Commons Attribution-NoDerivs license, for more details see here
| Reference: Kozlowski LP. Proteome-pI 2.0: Proteome Isoelectric Point Database Update. Nucleic Acids Res. 2021, doi: 10.1093/nar/gkab944 | Contact: Lukasz P. Kozlowski |
