Lachnospiraceae bacterium XPB1003
Taxonomy: cellular organisms; Bacteria; Terrabacteria group; Firmicutes; Clostridia; Eubacteriales; Lachnospiraceae; unclassified Lachnospiraceae
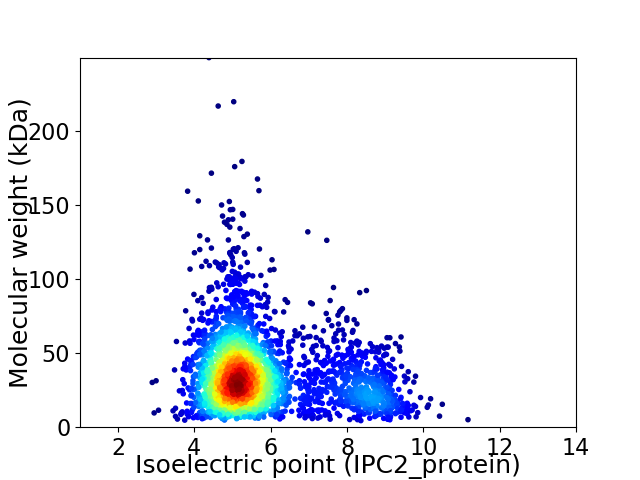
Average proteome isoelectric point is 5.77
Get precalculated fractions of proteins

Virtual 2D-PAGE plot for 2824 proteins (isoelectric point calculated using IPC2_protein)
Get csv file with sequences according to given criteria:
* You can choose from 21 different methods for calculating isoelectric point
Summary statistics related to proteome-wise predictions


Protein with the lowest isoelectric point:
>tr|A0A1G5AW09|A0A1G5AW09_9FIRM Isoleucine--tRNA ligase OS=Lachnospiraceae bacterium XPB1003 OX=1520825 GN=ileS PE=3 SV=1
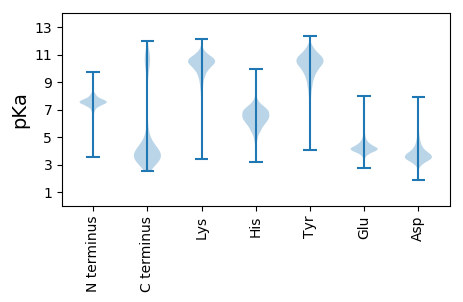
MM1 pKa = 7.71KK2 pKa = 10.06KK3 pKa = 9.69RR4 pKa = 11.84NRR6 pKa = 11.84MISAALTMMAALSLTACAGTADD28 pKa = 3.87QGSVQTPDD36 pKa = 2.94TAAQAGDD43 pKa = 3.52VTEE46 pKa = 4.25QTTGATDD53 pKa = 3.43EE54 pKa = 4.42VEE56 pKa = 3.91EE57 pKa = 4.43GTVYY61 pKa = 10.85KK62 pKa = 10.42IGVCNYY68 pKa = 10.03VDD70 pKa = 4.23DD71 pKa = 5.64ASLNQIYY78 pKa = 10.58EE79 pKa = 4.24NIEE82 pKa = 3.79AQLDD86 pKa = 3.91VLGSEE91 pKa = 3.94QGVTYY96 pKa = 10.02EE97 pKa = 4.98IVYY100 pKa = 10.33DD101 pKa = 3.88NCNADD106 pKa = 3.88ANVMNQIIEE115 pKa = 4.13NFISGEE121 pKa = 4.13KK122 pKa = 9.15VDD124 pKa = 4.46LMVGIATPVAMTMQSATEE142 pKa = 3.96DD143 pKa = 3.48TQIPVIFSAVSDD155 pKa = 4.1PLSAGLVDD163 pKa = 5.08SLDD166 pKa = 3.94APGHH170 pKa = 6.27NITGTSDD177 pKa = 3.47YY178 pKa = 10.8LNTDD182 pKa = 3.86AIMDD186 pKa = 4.25LMFEE190 pKa = 4.86ADD192 pKa = 4.0PDD194 pKa = 3.79IQTVGLLYY202 pKa = 11.1DD203 pKa = 3.99MGQDD207 pKa = 3.35ASTSAINDD215 pKa = 3.09AKK217 pKa = 11.01AYY219 pKa = 10.72LDD221 pKa = 3.58AKK223 pKa = 9.14GIKK226 pKa = 9.58YY227 pKa = 9.88IEE229 pKa = 4.18RR230 pKa = 11.84TGTTVDD236 pKa = 3.65EE237 pKa = 4.49VMLAADD243 pKa = 4.55TLAKK247 pKa = 9.83SDD249 pKa = 3.68KK250 pKa = 9.98VDD252 pKa = 3.71AVFTPTDD259 pKa = 3.64NTIMTAEE266 pKa = 4.09LSIYY270 pKa = 7.91EE271 pKa = 4.31TFAEE275 pKa = 4.33AGIPHH280 pKa = 6.55YY281 pKa = 10.91CGADD285 pKa = 3.14SFALNGAFLGFGVDD299 pKa = 3.59YY300 pKa = 11.37ANIGVEE306 pKa = 4.17TANMVSEE313 pKa = 4.08VLYY316 pKa = 10.32EE317 pKa = 4.5GKK319 pKa = 10.27DD320 pKa = 3.39PATLGVKK327 pKa = 9.3TFDD330 pKa = 4.28NGIATINTEE339 pKa = 3.82TCDD342 pKa = 4.18AIGFDD347 pKa = 4.39LEE349 pKa = 4.61TVKK352 pKa = 10.87KK353 pKa = 10.5AFEE356 pKa = 3.99PHH358 pKa = 6.01CTDD361 pKa = 2.53IVEE364 pKa = 4.15ITTAEE369 pKa = 4.09EE370 pKa = 4.01FF371 pKa = 3.66
MM1 pKa = 7.71KK2 pKa = 10.06KK3 pKa = 9.69RR4 pKa = 11.84NRR6 pKa = 11.84MISAALTMMAALSLTACAGTADD28 pKa = 3.87QGSVQTPDD36 pKa = 2.94TAAQAGDD43 pKa = 3.52VTEE46 pKa = 4.25QTTGATDD53 pKa = 3.43EE54 pKa = 4.42VEE56 pKa = 3.91EE57 pKa = 4.43GTVYY61 pKa = 10.85KK62 pKa = 10.42IGVCNYY68 pKa = 10.03VDD70 pKa = 4.23DD71 pKa = 5.64ASLNQIYY78 pKa = 10.58EE79 pKa = 4.24NIEE82 pKa = 3.79AQLDD86 pKa = 3.91VLGSEE91 pKa = 3.94QGVTYY96 pKa = 10.02EE97 pKa = 4.98IVYY100 pKa = 10.33DD101 pKa = 3.88NCNADD106 pKa = 3.88ANVMNQIIEE115 pKa = 4.13NFISGEE121 pKa = 4.13KK122 pKa = 9.15VDD124 pKa = 4.46LMVGIATPVAMTMQSATEE142 pKa = 3.96DD143 pKa = 3.48TQIPVIFSAVSDD155 pKa = 4.1PLSAGLVDD163 pKa = 5.08SLDD166 pKa = 3.94APGHH170 pKa = 6.27NITGTSDD177 pKa = 3.47YY178 pKa = 10.8LNTDD182 pKa = 3.86AIMDD186 pKa = 4.25LMFEE190 pKa = 4.86ADD192 pKa = 4.0PDD194 pKa = 3.79IQTVGLLYY202 pKa = 11.1DD203 pKa = 3.99MGQDD207 pKa = 3.35ASTSAINDD215 pKa = 3.09AKK217 pKa = 11.01AYY219 pKa = 10.72LDD221 pKa = 3.58AKK223 pKa = 9.14GIKK226 pKa = 9.58YY227 pKa = 9.88IEE229 pKa = 4.18RR230 pKa = 11.84TGTTVDD236 pKa = 3.65EE237 pKa = 4.49VMLAADD243 pKa = 4.55TLAKK247 pKa = 9.83SDD249 pKa = 3.68KK250 pKa = 9.98VDD252 pKa = 3.71AVFTPTDD259 pKa = 3.64NTIMTAEE266 pKa = 4.09LSIYY270 pKa = 7.91EE271 pKa = 4.31TFAEE275 pKa = 4.33AGIPHH280 pKa = 6.55YY281 pKa = 10.91CGADD285 pKa = 3.14SFALNGAFLGFGVDD299 pKa = 3.59YY300 pKa = 11.37ANIGVEE306 pKa = 4.17TANMVSEE313 pKa = 4.08VLYY316 pKa = 10.32EE317 pKa = 4.5GKK319 pKa = 10.27DD320 pKa = 3.39PATLGVKK327 pKa = 9.3TFDD330 pKa = 4.28NGIATINTEE339 pKa = 3.82TCDD342 pKa = 4.18AIGFDD347 pKa = 4.39LEE349 pKa = 4.61TVKK352 pKa = 10.87KK353 pKa = 10.5AFEE356 pKa = 3.99PHH358 pKa = 6.01CTDD361 pKa = 2.53IVEE364 pKa = 4.15ITTAEE369 pKa = 4.09EE370 pKa = 4.01FF371 pKa = 3.66
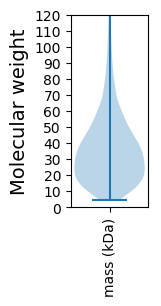
Molecular weight: 39.42 kDa
Isoelectric point according different methods:
Protein with the highest isoelectric point:
>tr|A0A1G5AV13|A0A1G5AV13_9FIRM DHH family protein OS=Lachnospiraceae bacterium XPB1003 OX=1520825 GN=SAMN02910370_00310 PE=4 SV=1
MM1 pKa = 7.67KK2 pKa = 8.73MTFQPKK8 pKa = 8.63NRR10 pKa = 11.84QRR12 pKa = 11.84SKK14 pKa = 8.89VHH16 pKa = 5.88GFRR19 pKa = 11.84ARR21 pKa = 11.84MSTPGGRR28 pKa = 11.84KK29 pKa = 8.71VLAARR34 pKa = 11.84RR35 pKa = 11.84RR36 pKa = 11.84KK37 pKa = 8.81GRR39 pKa = 11.84KK40 pKa = 8.75VLSAA44 pKa = 4.05
MM1 pKa = 7.67KK2 pKa = 8.73MTFQPKK8 pKa = 8.63NRR10 pKa = 11.84QRR12 pKa = 11.84SKK14 pKa = 8.89VHH16 pKa = 5.88GFRR19 pKa = 11.84ARR21 pKa = 11.84MSTPGGRR28 pKa = 11.84KK29 pKa = 8.71VLAARR34 pKa = 11.84RR35 pKa = 11.84RR36 pKa = 11.84KK37 pKa = 8.81GRR39 pKa = 11.84KK40 pKa = 8.75VLSAA44 pKa = 4.05
Molecular weight: 5.08 kDa
Isoelectric point according different methods:
Peptides (in silico digests for buttom-up proteomics)
Below you can find in silico digests of the whole proteome with Trypsin, Chymotrypsin, Trypsin+LysC, LysN, ArgC proteases suitable for different mass spec machines.| Try ESI |
 |
|---|
| ChTry ESI |
 |
|---|
| ArgC ESI |
 |
|---|
| LysN ESI |
 |
|---|
| TryLysC ESI |
 |
|---|
| Try MALDI |
 |
|---|
| ChTry MALDI |
 |
|---|
| ArgC MALDI |
 |
|---|
| LysN MALDI |
 |
|---|
| TryLysC MALDI |
 |
|---|
| Try LTQ |
 |
|---|
| ChTry LTQ |
 |
|---|
| ArgC LTQ |
 |
|---|
| LysN LTQ |
 |
|---|
| TryLysC LTQ |
 |
|---|
| Try MSlow |
 |
|---|
| ChTry MSlow |
 |
|---|
| ArgC MSlow |
 |
|---|
| LysN MSlow |
 |
|---|
| TryLysC MSlow |
 |
|---|
| Try MShigh |
 |
|---|
| ChTry MShigh |
 |
|---|
| ArgC MShigh |
 |
|---|
| LysN MShigh |
 |
|---|
| TryLysC MShigh |
 |
|---|
General Statistics
Number of major isoforms |
Number of additional isoforms |
Number of all proteins |
Number of amino acids |
Min. Seq. Length |
Max. Seq. Length |
Avg. Seq. Length |
Avg. Mol. Weight |
|---|---|---|---|---|---|---|---|
0 |
956784 |
39 |
2420 |
338.8 |
37.94 |
Amino acid frequency
Ala |
Cys |
Asp |
Glu |
Phe |
Gly |
His |
Ile |
Lys |
Leu |
|---|---|---|---|---|---|---|---|---|---|
7.549 ± 0.05 | 1.438 ± 0.017 |
6.709 ± 0.045 | 7.524 ± 0.05 |
4.314 ± 0.034 | 7.151 ± 0.039 |
1.605 ± 0.018 | 7.67 ± 0.043 |
6.992 ± 0.042 | 8.375 ± 0.047 |
Met |
Asn |
Gln |
Pro |
Arg |
Ser |
Thr |
Val |
Trp |
Tyr |
|---|---|---|---|---|---|---|---|---|---|
3.066 ± 0.023 | 4.36 ± 0.03 |
3.263 ± 0.025 | 2.346 ± 0.024 |
4.42 ± 0.036 | 6.242 ± 0.041 |
5.132 ± 0.031 | 6.758 ± 0.037 |
0.853 ± 0.015 | 4.232 ± 0.029 |
Most of the basic statistics you can see at this page can be downloaded from this CSV file
Proteome-pI is available under Creative Commons Attribution-NoDerivs license, for more details see here
| Reference: Kozlowski LP. Proteome-pI 2.0: Proteome Isoelectric Point Database Update. Nucleic Acids Res. 2021, doi: 10.1093/nar/gkab944 | Contact: Lukasz P. Kozlowski |
