Gonapodya prolifera (strain JEL478) (Monoblepharis prolifera)
Taxonomy: cellular organisms; Eukaryota; Opisthokonta; Fungi; Fungi incertae sedis; Chytridiomycota; Chytridiomycota incertae sedis; Monoblepharidomycetes; Monoblepharidales; Gonapodyaceae; Gonapodya; Gonapodya prolifera
Average proteome isoelectric point is 6.8
Get precalculated fractions of proteins

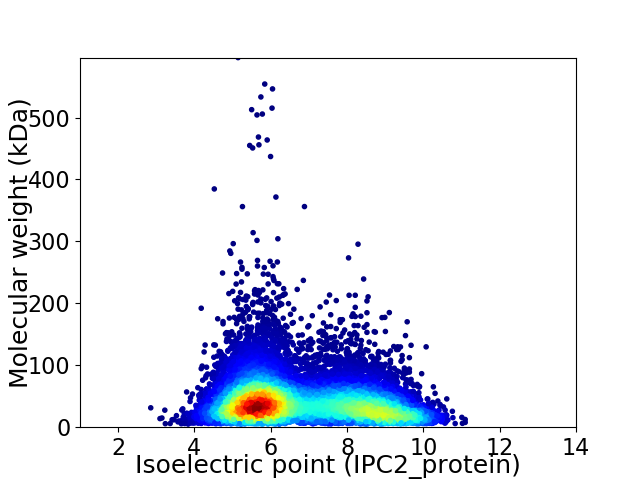
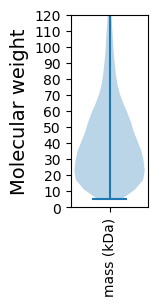
Virtual 2D-PAGE plot for 13801 proteins (isoelectric point calculated using IPC2_protein)
Get csv file with sequences according to given criteria:
* You can choose from 21 different methods for calculating isoelectric point
Summary statistics related to proteome-wise predictions


Protein with the lowest isoelectric point:
>tr|A0A139A1Q6|A0A139A1Q6_GONPJ t-SNARE OS=Gonapodya prolifera (strain JEL478) OX=1344416 GN=M427DRAFT_158862 PE=3 SV=1
MM1 pKa = 7.26PRR3 pKa = 11.84SRR5 pKa = 11.84EE6 pKa = 3.57EE7 pKa = 3.77ALRR10 pKa = 11.84MEE12 pKa = 4.8DD13 pKa = 3.85EE14 pKa = 4.33IEE16 pKa = 4.05EE17 pKa = 4.35GQYY20 pKa = 10.97EE21 pKa = 4.29PGEE24 pKa = 3.96LLEE27 pKa = 5.21IEE29 pKa = 4.42GDD31 pKa = 3.67GDD33 pKa = 3.61GLEE36 pKa = 4.14NVEE39 pKa = 4.97ASVDD43 pKa = 3.78DD44 pKa = 4.7LEE46 pKa = 5.05PPSTAPYY53 pKa = 10.27LGGEE57 pKa = 4.27GHH59 pKa = 6.93CARR62 pKa = 11.84GNGTDD67 pKa = 4.12NGWCVDD73 pKa = 3.76TQAAAVDD80 pKa = 4.08GSYY83 pKa = 11.08RR84 pKa = 11.84DD85 pKa = 3.24IALAALRR92 pKa = 11.84AVGMASLPTTIPSTVLNAQPASSHH116 pKa = 5.52FRR118 pKa = 11.84SPPSVPTCDD127 pKa = 3.32TQGRR131 pKa = 11.84PVWNGPDD138 pKa = 3.15WSTLTGLDD146 pKa = 3.85PYY148 pKa = 10.54GGPWVTMSEE157 pKa = 4.21PQVPPAGDD165 pKa = 3.12VDD167 pKa = 4.45GPSLQVDD174 pKa = 4.36DD175 pKa = 6.24DD176 pKa = 4.82IVWDD180 pKa = 3.76WAGCDD185 pKa = 3.45QSGEE189 pKa = 4.12IASALCWVTPMLRR202 pKa = 11.84GCDD205 pKa = 3.48LL206 pKa = 3.88
MM1 pKa = 7.26PRR3 pKa = 11.84SRR5 pKa = 11.84EE6 pKa = 3.57EE7 pKa = 3.77ALRR10 pKa = 11.84MEE12 pKa = 4.8DD13 pKa = 3.85EE14 pKa = 4.33IEE16 pKa = 4.05EE17 pKa = 4.35GQYY20 pKa = 10.97EE21 pKa = 4.29PGEE24 pKa = 3.96LLEE27 pKa = 5.21IEE29 pKa = 4.42GDD31 pKa = 3.67GDD33 pKa = 3.61GLEE36 pKa = 4.14NVEE39 pKa = 4.97ASVDD43 pKa = 3.78DD44 pKa = 4.7LEE46 pKa = 5.05PPSTAPYY53 pKa = 10.27LGGEE57 pKa = 4.27GHH59 pKa = 6.93CARR62 pKa = 11.84GNGTDD67 pKa = 4.12NGWCVDD73 pKa = 3.76TQAAAVDD80 pKa = 4.08GSYY83 pKa = 11.08RR84 pKa = 11.84DD85 pKa = 3.24IALAALRR92 pKa = 11.84AVGMASLPTTIPSTVLNAQPASSHH116 pKa = 5.52FRR118 pKa = 11.84SPPSVPTCDD127 pKa = 3.32TQGRR131 pKa = 11.84PVWNGPDD138 pKa = 3.15WSTLTGLDD146 pKa = 3.85PYY148 pKa = 10.54GGPWVTMSEE157 pKa = 4.21PQVPPAGDD165 pKa = 3.12VDD167 pKa = 4.45GPSLQVDD174 pKa = 4.36DD175 pKa = 6.24DD176 pKa = 4.82IVWDD180 pKa = 3.76WAGCDD185 pKa = 3.45QSGEE189 pKa = 4.12IASALCWVTPMLRR202 pKa = 11.84GCDD205 pKa = 3.48LL206 pKa = 3.88
Molecular weight: 21.84 kDa
Isoelectric point according different methods:
Protein with the highest isoelectric point:
>tr|A0A139AQD2|A0A139AQD2_GONPJ Peptidylprolyl isomerase OS=Gonapodya prolifera (strain JEL478) OX=1344416 GN=M427DRAFT_53658 PE=4 SV=1
MM1 pKa = 6.82YY2 pKa = 9.11TSQHH6 pKa = 6.43LLPLSLSQHH15 pKa = 6.04VSTQPPTTSSPPSALMPRR33 pKa = 11.84PAPRR37 pKa = 11.84TLASAATPATLPRR50 pKa = 11.84RR51 pKa = 11.84RR52 pKa = 11.84RR53 pKa = 11.84RR54 pKa = 11.84FTRR57 pKa = 11.84PTAASFFRR65 pKa = 11.84TRR67 pKa = 11.84RR68 pKa = 11.84GLL70 pKa = 3.45
MM1 pKa = 6.82YY2 pKa = 9.11TSQHH6 pKa = 6.43LLPLSLSQHH15 pKa = 6.04VSTQPPTTSSPPSALMPRR33 pKa = 11.84PAPRR37 pKa = 11.84TLASAATPATLPRR50 pKa = 11.84RR51 pKa = 11.84RR52 pKa = 11.84RR53 pKa = 11.84RR54 pKa = 11.84FTRR57 pKa = 11.84PTAASFFRR65 pKa = 11.84TRR67 pKa = 11.84RR68 pKa = 11.84GLL70 pKa = 3.45
Molecular weight: 7.75 kDa
Isoelectric point according different methods:
Peptides (in silico digests for buttom-up proteomics)
Below you can find in silico digests of the whole proteome with Trypsin, Chymotrypsin, Trypsin+LysC, LysN, ArgC proteases suitable for different mass spec machines.| Try ESI |
 |
|---|
| ChTry ESI |
 |
|---|
| ArgC ESI |
 |
|---|
| LysN ESI |
 |
|---|
| TryLysC ESI |
 |
|---|
| Try MALDI |
 |
|---|
| ChTry MALDI |
 |
|---|
| ArgC MALDI |
 |
|---|
| LysN MALDI |
 |
|---|
| TryLysC MALDI |
 |
|---|
| Try LTQ |
 |
|---|
| ChTry LTQ |
 |
|---|
| ArgC LTQ |
 |
|---|
| LysN LTQ |
 |
|---|
| TryLysC LTQ |
 |
|---|
| Try MSlow |
 |
|---|
| ChTry MSlow |
 |
|---|
| ArgC MSlow |
 |
|---|
| LysN MSlow |
 |
|---|
| TryLysC MSlow |
 |
|---|
| Try MShigh |
 |
|---|
| ChTry MShigh |
 |
|---|
| ArgC MShigh |
 |
|---|
| LysN MShigh |
 |
|---|
| TryLysC MShigh |
 |
|---|
General Statistics
Number of major isoforms |
Number of additional isoforms |
Number of all proteins |
Number of amino acids |
Min. Seq. Length |
Max. Seq. Length |
Avg. Seq. Length |
Avg. Mol. Weight |
|---|---|---|---|---|---|---|---|
5698899 |
49 |
5347 |
412.9 |
45.13 |
Amino acid frequency
Ala |
Cys |
Asp |
Glu |
Phe |
Gly |
His |
Ile |
Lys |
Leu |
|---|---|---|---|---|---|---|---|---|---|
9.281 ± 0.023 | 1.231 ± 0.009 |
5.42 ± 0.015 | 5.84 ± 0.025 |
3.545 ± 0.014 | 7.458 ± 0.021 |
2.346 ± 0.011 | 4.229 ± 0.017 |
4.373 ± 0.019 | 8.976 ± 0.027 |
Met |
Asn |
Gln |
Pro |
Arg |
Ser |
Thr |
Val |
Trp |
Tyr |
|---|---|---|---|---|---|---|---|---|---|
2.042 ± 0.008 | 3.211 ± 0.012 |
6.618 ± 0.031 | 3.42 ± 0.015 |
6.488 ± 0.021 | 8.51 ± 0.024 |
6.148 ± 0.019 | 7.085 ± 0.016 |
1.433 ± 0.008 | 2.311 ± 0.012 |
Most of the basic statistics you can see at this page can be downloaded from this CSV file
Proteome-pI is available under Creative Commons Attribution-NoDerivs license, for more details see here
| Reference: Kozlowski LP. Proteome-pI 2.0: Proteome Isoelectric Point Database Update. Nucleic Acids Res. 2021, doi: 10.1093/nar/gkab944 | Contact: Lukasz P. Kozlowski |
