Flaviramulus basaltis
Taxonomy: cellular organisms; Bacteria; FCB group; Bacteroidetes/Chlorobi group; Bacteroidetes; Flavobacteriia; Flavobacteriales; Flavobacteriaceae; Flaviramulus
Average proteome isoelectric point is 6.57
Get precalculated fractions of proteins

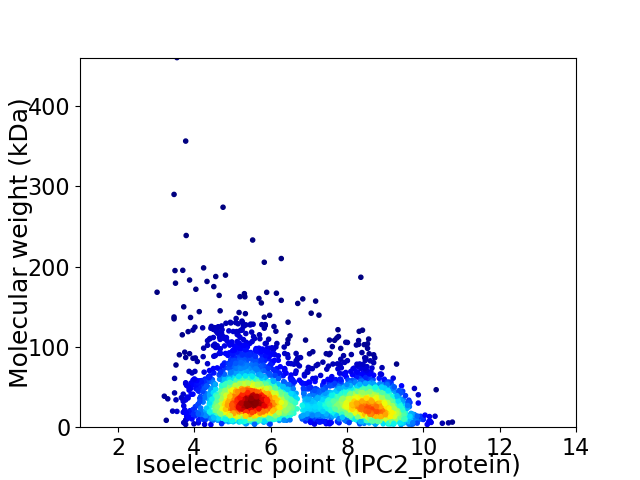
Virtual 2D-PAGE plot for 3670 proteins (isoelectric point calculated using IPC2_protein)
Get csv file with sequences according to given criteria:
* You can choose from 21 different methods for calculating isoelectric point
Summary statistics related to proteome-wise predictions


Protein with the lowest isoelectric point:
>tr|A0A1K2IHV2|A0A1K2IHV2_9FLAO Solute:Na+ symporter SSS family OS=Flaviramulus basaltis OX=369401 GN=SAMN05428642_102475 PE=3 SV=1
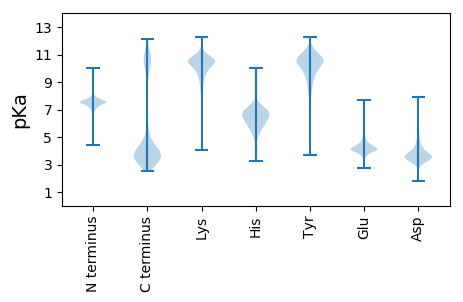
MM1 pKa = 7.67RR2 pKa = 11.84KK3 pKa = 9.88YY4 pKa = 11.26YY5 pKa = 10.72LILLALLITIMSYY18 pKa = 11.09AQMGVGTTFPDD29 pKa = 3.46EE30 pKa = 4.24SAQLDD35 pKa = 3.95VVSNDD40 pKa = 2.98KK41 pKa = 11.2GILIPRR47 pKa = 11.84VTLQNSTDD55 pKa = 3.32TTTISSDD62 pKa = 3.44LLSNPISLLVYY73 pKa = 8.31NTKK76 pKa = 10.77ASGDD80 pKa = 4.0LIEE83 pKa = 6.32GYY85 pKa = 10.38HH86 pKa = 5.56YY87 pKa = 10.82WNGSKK92 pKa = 9.41WLRR95 pKa = 11.84LINSDD100 pKa = 3.89DD101 pKa = 3.99SNGVVTTLVDD111 pKa = 3.73NNDD114 pKa = 3.05GTFTYY119 pKa = 10.07TSEE122 pKa = 4.71NNTQTTFDD130 pKa = 4.34ADD132 pKa = 3.69GDD134 pKa = 4.58LIDD137 pKa = 4.72NNNGTFTYY145 pKa = 10.05TNAANTVTTFDD156 pKa = 3.64AKK158 pKa = 9.84LTSVIDD164 pKa = 3.98NSDD167 pKa = 3.08GTYY170 pKa = 10.33TITDD174 pKa = 3.68DD175 pKa = 3.86FGISITIGGATEE187 pKa = 4.16TTTTLVDD194 pKa = 3.72NNDD197 pKa = 3.05GTFTYY202 pKa = 10.04TSEE205 pKa = 5.71DD206 pKa = 3.39NTQTTLTSGSLTNNGDD222 pKa = 3.09GSYY225 pKa = 9.32TFTDD229 pKa = 3.04ATGINTTILASTGLAIEE246 pKa = 4.4PWNGVDD252 pKa = 5.09DD253 pKa = 5.02NGPATDD259 pKa = 3.83NTEE262 pKa = 4.59DD263 pKa = 3.94IYY265 pKa = 11.42TLGDD269 pKa = 3.29VGIGTNTPSATLEE282 pKa = 4.03VNGNVIIGNGGTAIRR297 pKa = 11.84RR298 pKa = 11.84SLSTTAVLDD307 pKa = 4.04FPDD310 pKa = 3.57RR311 pKa = 11.84RR312 pKa = 11.84VINQPEE318 pKa = 4.23LTITLAGANIGDD330 pKa = 4.25VLCLGVPPAAMITFAYY346 pKa = 9.05YY347 pKa = 9.83IAWVSSPNVITIKK360 pKa = 10.28QRR362 pKa = 11.84NSSYY366 pKa = 11.2NPSDD370 pKa = 3.32SDD372 pKa = 3.75APPATFRR379 pKa = 11.84VTVFQYY385 pKa = 11.32
MM1 pKa = 7.67RR2 pKa = 11.84KK3 pKa = 9.88YY4 pKa = 11.26YY5 pKa = 10.72LILLALLITIMSYY18 pKa = 11.09AQMGVGTTFPDD29 pKa = 3.46EE30 pKa = 4.24SAQLDD35 pKa = 3.95VVSNDD40 pKa = 2.98KK41 pKa = 11.2GILIPRR47 pKa = 11.84VTLQNSTDD55 pKa = 3.32TTTISSDD62 pKa = 3.44LLSNPISLLVYY73 pKa = 8.31NTKK76 pKa = 10.77ASGDD80 pKa = 4.0LIEE83 pKa = 6.32GYY85 pKa = 10.38HH86 pKa = 5.56YY87 pKa = 10.82WNGSKK92 pKa = 9.41WLRR95 pKa = 11.84LINSDD100 pKa = 3.89DD101 pKa = 3.99SNGVVTTLVDD111 pKa = 3.73NNDD114 pKa = 3.05GTFTYY119 pKa = 10.07TSEE122 pKa = 4.71NNTQTTFDD130 pKa = 4.34ADD132 pKa = 3.69GDD134 pKa = 4.58LIDD137 pKa = 4.72NNNGTFTYY145 pKa = 10.05TNAANTVTTFDD156 pKa = 3.64AKK158 pKa = 9.84LTSVIDD164 pKa = 3.98NSDD167 pKa = 3.08GTYY170 pKa = 10.33TITDD174 pKa = 3.68DD175 pKa = 3.86FGISITIGGATEE187 pKa = 4.16TTTTLVDD194 pKa = 3.72NNDD197 pKa = 3.05GTFTYY202 pKa = 10.04TSEE205 pKa = 5.71DD206 pKa = 3.39NTQTTLTSGSLTNNGDD222 pKa = 3.09GSYY225 pKa = 9.32TFTDD229 pKa = 3.04ATGINTTILASTGLAIEE246 pKa = 4.4PWNGVDD252 pKa = 5.09DD253 pKa = 5.02NGPATDD259 pKa = 3.83NTEE262 pKa = 4.59DD263 pKa = 3.94IYY265 pKa = 11.42TLGDD269 pKa = 3.29VGIGTNTPSATLEE282 pKa = 4.03VNGNVIIGNGGTAIRR297 pKa = 11.84RR298 pKa = 11.84SLSTTAVLDD307 pKa = 4.04FPDD310 pKa = 3.57RR311 pKa = 11.84RR312 pKa = 11.84VINQPEE318 pKa = 4.23LTITLAGANIGDD330 pKa = 4.25VLCLGVPPAAMITFAYY346 pKa = 9.05YY347 pKa = 9.83IAWVSSPNVITIKK360 pKa = 10.28QRR362 pKa = 11.84NSSYY366 pKa = 11.2NPSDD370 pKa = 3.32SDD372 pKa = 3.75APPATFRR379 pKa = 11.84VTVFQYY385 pKa = 11.32
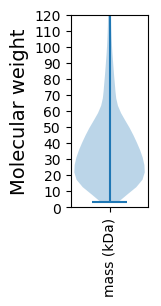
Molecular weight: 41.13 kDa
Isoelectric point according different methods:
Protein with the highest isoelectric point:
>tr|A0A1K2IJE8|A0A1K2IJE8_9FLAO PAS domain S-box-containing protein OS=Flaviramulus basaltis OX=369401 GN=SAMN05428642_102673 PE=4 SV=1
MM1 pKa = 7.69SKK3 pKa = 9.01RR4 pKa = 11.84TFQPSKK10 pKa = 9.13RR11 pKa = 11.84KK12 pKa = 9.48RR13 pKa = 11.84RR14 pKa = 11.84NKK16 pKa = 9.49HH17 pKa = 3.94GFRR20 pKa = 11.84EE21 pKa = 4.27RR22 pKa = 11.84MASANGRR29 pKa = 11.84KK30 pKa = 9.04VLARR34 pKa = 11.84RR35 pKa = 11.84RR36 pKa = 11.84AKK38 pKa = 10.09GRR40 pKa = 11.84KK41 pKa = 8.0KK42 pKa = 10.66LSVSTEE48 pKa = 3.92TRR50 pKa = 11.84HH51 pKa = 6.44KK52 pKa = 10.57KK53 pKa = 9.81
MM1 pKa = 7.69SKK3 pKa = 9.01RR4 pKa = 11.84TFQPSKK10 pKa = 9.13RR11 pKa = 11.84KK12 pKa = 9.48RR13 pKa = 11.84RR14 pKa = 11.84NKK16 pKa = 9.49HH17 pKa = 3.94GFRR20 pKa = 11.84EE21 pKa = 4.27RR22 pKa = 11.84MASANGRR29 pKa = 11.84KK30 pKa = 9.04VLARR34 pKa = 11.84RR35 pKa = 11.84RR36 pKa = 11.84AKK38 pKa = 10.09GRR40 pKa = 11.84KK41 pKa = 8.0KK42 pKa = 10.66LSVSTEE48 pKa = 3.92TRR50 pKa = 11.84HH51 pKa = 6.44KK52 pKa = 10.57KK53 pKa = 9.81
Molecular weight: 6.34 kDa
Isoelectric point according different methods:
Peptides (in silico digests for buttom-up proteomics)
Below you can find in silico digests of the whole proteome with Trypsin, Chymotrypsin, Trypsin+LysC, LysN, ArgC proteases suitable for different mass spec machines.| Try ESI |
 |
|---|
| ChTry ESI |
 |
|---|
| ArgC ESI |
 |
|---|
| LysN ESI |
 |
|---|
| TryLysC ESI |
 |
|---|
| Try MALDI |
 |
|---|
| ChTry MALDI |
 |
|---|
| ArgC MALDI |
 |
|---|
| LysN MALDI |
 |
|---|
| TryLysC MALDI |
 |
|---|
| Try LTQ |
 |
|---|
| ChTry LTQ |
 |
|---|
| ArgC LTQ |
 |
|---|
| LysN LTQ |
 |
|---|
| TryLysC LTQ |
 |
|---|
| Try MSlow |
 |
|---|
| ChTry MSlow |
 |
|---|
| ArgC MSlow |
 |
|---|
| LysN MSlow |
 |
|---|
| TryLysC MSlow |
 |
|---|
| Try MShigh |
 |
|---|
| ChTry MShigh |
 |
|---|
| ArgC MShigh |
 |
|---|
| LysN MShigh |
 |
|---|
| TryLysC MShigh |
 |
|---|
General Statistics
Number of major isoforms |
Number of additional isoforms |
Number of all proteins |
Number of amino acids |
Min. Seq. Length |
Max. Seq. Length |
Avg. Seq. Length |
Avg. Mol. Weight |
|---|---|---|---|---|---|---|---|
0 |
1276762 |
28 |
4418 |
347.9 |
39.31 |
Amino acid frequency
Ala |
Cys |
Asp |
Glu |
Phe |
Gly |
His |
Ile |
Lys |
Leu |
|---|---|---|---|---|---|---|---|---|---|
5.895 ± 0.045 | 0.745 ± 0.013 |
5.698 ± 0.033 | 6.482 ± 0.04 |
5.301 ± 0.031 | 6.236 ± 0.043 |
1.696 ± 0.021 | 8.45 ± 0.038 |
8.081 ± 0.065 | 9.216 ± 0.045 |
Met |
Asn |
Gln |
Pro |
Arg |
Ser |
Thr |
Val |
Trp |
Tyr |
|---|---|---|---|---|---|---|---|---|---|
2.068 ± 0.024 | 6.901 ± 0.046 |
3.243 ± 0.022 | 3.138 ± 0.023 |
3.06 ± 0.028 | 6.701 ± 0.034 |
5.883 ± 0.056 | 5.96 ± 0.028 |
1.055 ± 0.015 | 4.192 ± 0.025 |
Most of the basic statistics you can see at this page can be downloaded from this CSV file
Proteome-pI is available under Creative Commons Attribution-NoDerivs license, for more details see here
| Reference: Kozlowski LP. Proteome-pI 2.0: Proteome Isoelectric Point Database Update. Nucleic Acids Res. 2021, doi: 10.1093/nar/gkab944 | Contact: Lukasz P. Kozlowski |
