Apis mellifera associated microvirus 29
Taxonomy: Viruses; Monodnaviria; Sangervirae; Phixviricota; Malgrandaviricetes; Petitvirales; Microviridae; unclassified Microviridae
Average proteome isoelectric point is 6.71
Get precalculated fractions of proteins

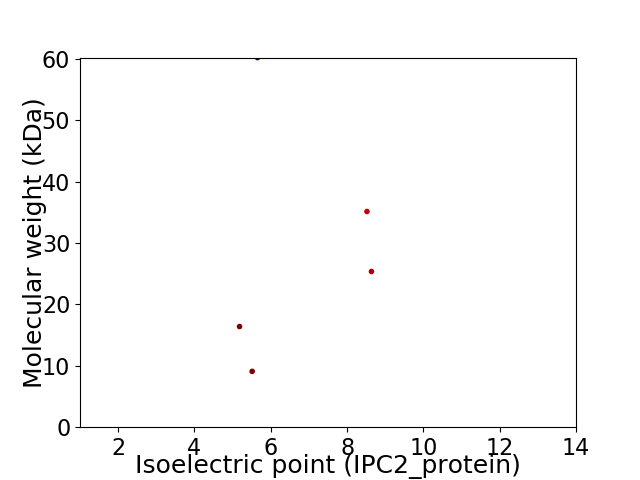
Virtual 2D-PAGE plot for 5 proteins (isoelectric point calculated using IPC2_protein)
Get csv file with sequences according to given criteria:
* You can choose from 21 different methods for calculating isoelectric point
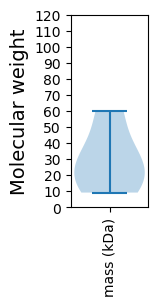
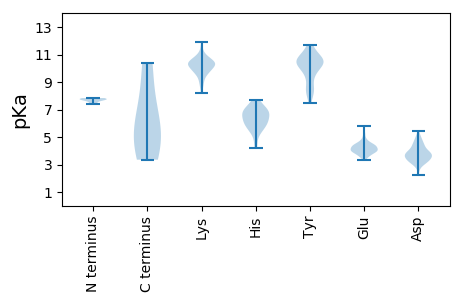
Summary statistics related to proteome-wise predictions


Protein with the lowest isoelectric point:
>tr|A0A3Q8U516|A0A3Q8U516_9VIRU Major capsid protein OS=Apis mellifera associated microvirus 29 OX=2494757 PE=3 SV=1
MM1 pKa = 7.74KK2 pKa = 8.93FTNHH6 pKa = 4.73IQEE9 pKa = 3.74TRR11 pKa = 11.84RR12 pKa = 11.84RR13 pKa = 11.84VTIDD17 pKa = 3.05CSEE20 pKa = 4.19PQVTDD25 pKa = 3.29QSFKK29 pKa = 10.91KK30 pKa = 10.63AVDD33 pKa = 3.14INNIMKK39 pKa = 10.14QYY41 pKa = 10.02EE42 pKa = 4.32KK43 pKa = 10.5TGVLPSGNNRR53 pKa = 11.84QPQFIDD59 pKa = 3.17TTLIPSLEE67 pKa = 3.96EE68 pKa = 3.56SFNIVNQAYY77 pKa = 10.29DD78 pKa = 3.93LFYY81 pKa = 10.73QLPATIRR88 pKa = 11.84KK89 pKa = 9.44LMDD92 pKa = 3.68NDD94 pKa = 3.54ASKK97 pKa = 11.55LEE99 pKa = 4.49AFLSDD104 pKa = 3.76PQNHH108 pKa = 5.79EE109 pKa = 4.03LCLQYY114 pKa = 11.72GLITKK119 pKa = 8.56PQEE122 pKa = 3.92TTPTEE127 pKa = 4.48GVKK130 pKa = 9.03STPGIIPSEE139 pKa = 3.95NTQQNN144 pKa = 3.35
MM1 pKa = 7.74KK2 pKa = 8.93FTNHH6 pKa = 4.73IQEE9 pKa = 3.74TRR11 pKa = 11.84RR12 pKa = 11.84RR13 pKa = 11.84VTIDD17 pKa = 3.05CSEE20 pKa = 4.19PQVTDD25 pKa = 3.29QSFKK29 pKa = 10.91KK30 pKa = 10.63AVDD33 pKa = 3.14INNIMKK39 pKa = 10.14QYY41 pKa = 10.02EE42 pKa = 4.32KK43 pKa = 10.5TGVLPSGNNRR53 pKa = 11.84QPQFIDD59 pKa = 3.17TTLIPSLEE67 pKa = 3.96EE68 pKa = 3.56SFNIVNQAYY77 pKa = 10.29DD78 pKa = 3.93LFYY81 pKa = 10.73QLPATIRR88 pKa = 11.84KK89 pKa = 9.44LMDD92 pKa = 3.68NDD94 pKa = 3.54ASKK97 pKa = 11.55LEE99 pKa = 4.49AFLSDD104 pKa = 3.76PQNHH108 pKa = 5.79EE109 pKa = 4.03LCLQYY114 pKa = 11.72GLITKK119 pKa = 8.56PQEE122 pKa = 3.92TTPTEE127 pKa = 4.48GVKK130 pKa = 9.03STPGIIPSEE139 pKa = 3.95NTQQNN144 pKa = 3.35
Molecular weight: 16.39 kDa
Isoelectric point according different methods:
Protein with the highest isoelectric point:
>tr|A0A3S8UU61|A0A3S8UU61_9VIRU DNA pilot protein OS=Apis mellifera associated microvirus 29 OX=2494757 PE=4 SV=1
MM1 pKa = 7.42SLATGLSLVDD11 pKa = 3.37TAANIWSARR20 pKa = 11.84NANKK24 pKa = 9.85QNQAMARR31 pKa = 11.84EE32 pKa = 3.94QMAFQEE38 pKa = 4.4RR39 pKa = 11.84MSNTAHH45 pKa = 5.48QRR47 pKa = 11.84EE48 pKa = 4.41VADD51 pKa = 4.87LKK53 pKa = 11.28AAGLNPILSAGGSGASSPGGASASVTPEE81 pKa = 3.81VQGSPLSTALARR93 pKa = 11.84HH94 pKa = 5.94NEE96 pKa = 3.88NATAKK101 pKa = 10.06QALNNAKK108 pKa = 10.21AQEE111 pKa = 4.33TLLGTQNEE119 pKa = 4.39KK120 pKa = 10.27TKK122 pKa = 10.89VDD124 pKa = 5.03AINSAADD131 pKa = 3.54TRR133 pKa = 11.84KK134 pKa = 10.45KK135 pKa = 9.65MAEE138 pKa = 4.01AKK140 pKa = 10.54NADD143 pKa = 3.91TLNLKK148 pKa = 10.31LSQDD152 pKa = 3.38IQNGAIQQQMLKK164 pKa = 10.48LALPKK169 pKa = 10.37LLNEE173 pKa = 4.21AQFEE177 pKa = 4.26KK178 pKa = 10.6DD179 pKa = 2.96YY180 pKa = 11.51GAAKK184 pKa = 10.07RR185 pKa = 11.84KK186 pKa = 9.89SDD188 pKa = 3.86ALLDD192 pKa = 3.92TVNKK196 pKa = 9.57GLHH199 pKa = 6.25GANQVKK205 pKa = 10.41NLFNPLRR212 pKa = 11.84GIFGGSNTEE221 pKa = 4.04TVIDD225 pKa = 4.37GNTGEE230 pKa = 4.96ILDD233 pKa = 4.17QIRR236 pKa = 11.84KK237 pKa = 8.51KK238 pKa = 10.22HH239 pKa = 5.12
MM1 pKa = 7.42SLATGLSLVDD11 pKa = 3.37TAANIWSARR20 pKa = 11.84NANKK24 pKa = 9.85QNQAMARR31 pKa = 11.84EE32 pKa = 3.94QMAFQEE38 pKa = 4.4RR39 pKa = 11.84MSNTAHH45 pKa = 5.48QRR47 pKa = 11.84EE48 pKa = 4.41VADD51 pKa = 4.87LKK53 pKa = 11.28AAGLNPILSAGGSGASSPGGASASVTPEE81 pKa = 3.81VQGSPLSTALARR93 pKa = 11.84HH94 pKa = 5.94NEE96 pKa = 3.88NATAKK101 pKa = 10.06QALNNAKK108 pKa = 10.21AQEE111 pKa = 4.33TLLGTQNEE119 pKa = 4.39KK120 pKa = 10.27TKK122 pKa = 10.89VDD124 pKa = 5.03AINSAADD131 pKa = 3.54TRR133 pKa = 11.84KK134 pKa = 10.45KK135 pKa = 9.65MAEE138 pKa = 4.01AKK140 pKa = 10.54NADD143 pKa = 3.91TLNLKK148 pKa = 10.31LSQDD152 pKa = 3.38IQNGAIQQQMLKK164 pKa = 10.48LALPKK169 pKa = 10.37LLNEE173 pKa = 4.21AQFEE177 pKa = 4.26KK178 pKa = 10.6DD179 pKa = 2.96YY180 pKa = 11.51GAAKK184 pKa = 10.07RR185 pKa = 11.84KK186 pKa = 9.89SDD188 pKa = 3.86ALLDD192 pKa = 3.92TVNKK196 pKa = 9.57GLHH199 pKa = 6.25GANQVKK205 pKa = 10.41NLFNPLRR212 pKa = 11.84GIFGGSNTEE221 pKa = 4.04TVIDD225 pKa = 4.37GNTGEE230 pKa = 4.96ILDD233 pKa = 4.17QIRR236 pKa = 11.84KK237 pKa = 8.51KK238 pKa = 10.22HH239 pKa = 5.12
Molecular weight: 25.36 kDa
Isoelectric point according different methods:
Peptides (in silico digests for buttom-up proteomics)
Below you can find in silico digests of the whole proteome with Trypsin, Chymotrypsin, Trypsin+LysC, LysN, ArgC proteases suitable for different mass spec machines.| Try ESI |
 |
|---|
| ChTry ESI |
 |
|---|
| ArgC ESI |
 |
|---|
| LysN ESI |
 |
|---|
| TryLysC ESI |
 |
|---|
| Try MALDI |
 |
|---|
| ChTry MALDI |
 |
|---|
| ArgC MALDI |
 |
|---|
| LysN MALDI |
 |
|---|
| TryLysC MALDI |
 |
|---|
| Try LTQ |
 |
|---|
| ChTry LTQ |
 |
|---|
| ArgC LTQ |
 |
|---|
| LysN LTQ |
 |
|---|
| TryLysC LTQ |
 |
|---|
| Try MSlow |
 |
|---|
| ChTry MSlow |
 |
|---|
| ArgC MSlow |
 |
|---|
| LysN MSlow |
 |
|---|
| TryLysC MSlow |
 |
|---|
| Try MShigh |
 |
|---|
| ChTry MShigh |
 |
|---|
| ArgC MShigh |
 |
|---|
| LysN MShigh |
 |
|---|
| TryLysC MShigh |
 |
|---|
General Statistics
Number of major isoforms |
Number of additional isoforms |
Number of all proteins |
Number of amino acids |
Min. Seq. Length |
Max. Seq. Length |
Avg. Seq. Length |
Avg. Mol. Weight |
|---|---|---|---|---|---|---|---|
0 |
1309 |
80 |
545 |
261.8 |
29.23 |
Amino acid frequency
Ala |
Cys |
Asp |
Glu |
Phe |
Gly |
His |
Ile |
Lys |
Leu |
|---|---|---|---|---|---|---|---|---|---|
8.327 ± 1.772 | 0.84 ± 0.359 |
5.042 ± 0.182 | 5.653 ± 0.926 |
4.736 ± 0.896 | 6.57 ± 0.967 |
2.674 ± 0.599 | 5.73 ± 0.51 |
6.188 ± 1.595 | 8.403 ± 0.634 |
Met |
Asn |
Gln |
Pro |
Arg |
Ser |
Thr |
Val |
Trp |
Tyr |
|---|---|---|---|---|---|---|---|---|---|
1.833 ± 0.218 | 6.57 ± 0.744 |
5.195 ± 0.728 | 5.042 ± 0.983 |
4.66 ± 0.552 | 6.723 ± 0.241 |
7.563 ± 0.596 | 3.82 ± 0.478 |
0.764 ± 0.265 | 3.667 ± 0.925 |
Most of the basic statistics you can see at this page can be downloaded from this CSV file
Proteome-pI is available under Creative Commons Attribution-NoDerivs license, for more details see here
| Reference: Kozlowski LP. Proteome-pI 2.0: Proteome Isoelectric Point Database Update. Nucleic Acids Res. 2021, doi: 10.1093/nar/gkab944 | Contact: Lukasz P. Kozlowski |
