Ornithinimicrobium pratense
Taxonomy: cellular organisms; Bacteria; Terrabacteria group; Actinobacteria; Actinomycetia; Micrococcales; Ornithinimicrobiaceae; Ornithinimicrobium
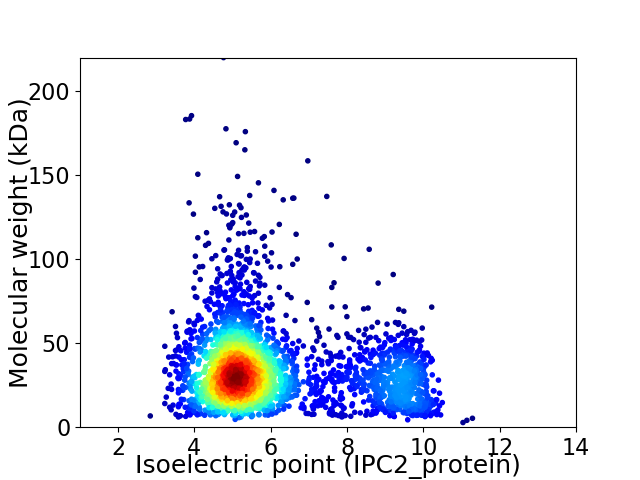
Average proteome isoelectric point is 6.09
Get precalculated fractions of proteins

Virtual 2D-PAGE plot for 3076 proteins (isoelectric point calculated using IPC2_protein)
Get csv file with sequences according to given criteria:
* You can choose from 21 different methods for calculating isoelectric point
Summary statistics related to proteome-wise predictions


Protein with the lowest isoelectric point:
>tr|A0A5J6V240|A0A5J6V240_9MICO CHAT domain-containing protein OS=Ornithinimicrobium pratense OX=2593973 GN=FY030_02570 PE=4 SV=1
MM1 pKa = 7.44HH2 pKa = 7.64RR3 pKa = 11.84PFTLTALLAAAALALSACGSDD24 pKa = 3.69SAVEE28 pKa = 4.1NADD31 pKa = 3.6DD32 pKa = 5.02PGPLTVGVSPLPHH45 pKa = 7.7AEE47 pKa = 3.47ILQFVDD53 pKa = 5.14DD54 pKa = 4.78EE55 pKa = 4.43LAEE58 pKa = 4.11EE59 pKa = 4.64AGLDD63 pKa = 3.65LEE65 pKa = 5.0LVEE68 pKa = 4.69FTDD71 pKa = 4.0YY72 pKa = 11.07LQPNVALDD80 pKa = 4.62DD81 pKa = 4.5GSLDD85 pKa = 3.48ANYY88 pKa = 9.4FQHH91 pKa = 6.97APYY94 pKa = 10.26LAEE97 pKa = 3.9QEE99 pKa = 4.21AAAGYY104 pKa = 10.19DD105 pKa = 3.87FEE107 pKa = 6.28AVTPVHH113 pKa = 6.77LEE115 pKa = 3.67PLGLYY120 pKa = 10.09SATLGSVEE128 pKa = 5.02EE129 pKa = 4.69IPDD132 pKa = 3.87GAQIAIPNDD141 pKa = 3.45PTNGARR147 pKa = 11.84ALHH150 pKa = 6.44LLAEE154 pKa = 4.32QGLLTLADD162 pKa = 3.69TDD164 pKa = 4.01AASATVLDD172 pKa = 4.3IEE174 pKa = 5.38DD175 pKa = 3.81NARR178 pKa = 11.84DD179 pKa = 3.64LQFVEE184 pKa = 5.27IEE186 pKa = 4.0AAQLPRR192 pKa = 11.84SLPDD196 pKa = 2.86VDD198 pKa = 3.89AAVINGNYY206 pKa = 9.89AIQADD211 pKa = 4.86LSPATDD217 pKa = 3.46ALAAEE222 pKa = 4.6APEE225 pKa = 4.52DD226 pKa = 3.59NPYY229 pKa = 11.67ANLLVVRR236 pKa = 11.84AGDD239 pKa = 3.51EE240 pKa = 3.9SDD242 pKa = 3.38PRR244 pKa = 11.84IVQLAEE250 pKa = 3.86LLGSEE255 pKa = 4.42EE256 pKa = 3.9VAQFIEE262 pKa = 4.31EE263 pKa = 4.58TYY265 pKa = 10.95DD266 pKa = 3.4GAVISARR273 pKa = 11.84SAA275 pKa = 3.04
MM1 pKa = 7.44HH2 pKa = 7.64RR3 pKa = 11.84PFTLTALLAAAALALSACGSDD24 pKa = 3.69SAVEE28 pKa = 4.1NADD31 pKa = 3.6DD32 pKa = 5.02PGPLTVGVSPLPHH45 pKa = 7.7AEE47 pKa = 3.47ILQFVDD53 pKa = 5.14DD54 pKa = 4.78EE55 pKa = 4.43LAEE58 pKa = 4.11EE59 pKa = 4.64AGLDD63 pKa = 3.65LEE65 pKa = 5.0LVEE68 pKa = 4.69FTDD71 pKa = 4.0YY72 pKa = 11.07LQPNVALDD80 pKa = 4.62DD81 pKa = 4.5GSLDD85 pKa = 3.48ANYY88 pKa = 9.4FQHH91 pKa = 6.97APYY94 pKa = 10.26LAEE97 pKa = 3.9QEE99 pKa = 4.21AAAGYY104 pKa = 10.19DD105 pKa = 3.87FEE107 pKa = 6.28AVTPVHH113 pKa = 6.77LEE115 pKa = 3.67PLGLYY120 pKa = 10.09SATLGSVEE128 pKa = 5.02EE129 pKa = 4.69IPDD132 pKa = 3.87GAQIAIPNDD141 pKa = 3.45PTNGARR147 pKa = 11.84ALHH150 pKa = 6.44LLAEE154 pKa = 4.32QGLLTLADD162 pKa = 3.69TDD164 pKa = 4.01AASATVLDD172 pKa = 4.3IEE174 pKa = 5.38DD175 pKa = 3.81NARR178 pKa = 11.84DD179 pKa = 3.64LQFVEE184 pKa = 5.27IEE186 pKa = 4.0AAQLPRR192 pKa = 11.84SLPDD196 pKa = 2.86VDD198 pKa = 3.89AAVINGNYY206 pKa = 9.89AIQADD211 pKa = 4.86LSPATDD217 pKa = 3.46ALAAEE222 pKa = 4.6APEE225 pKa = 4.52DD226 pKa = 3.59NPYY229 pKa = 11.67ANLLVVRR236 pKa = 11.84AGDD239 pKa = 3.51EE240 pKa = 3.9SDD242 pKa = 3.38PRR244 pKa = 11.84IVQLAEE250 pKa = 3.86LLGSEE255 pKa = 4.42EE256 pKa = 3.9VAQFIEE262 pKa = 4.31EE263 pKa = 4.58TYY265 pKa = 10.95DD266 pKa = 3.4GAVISARR273 pKa = 11.84SAA275 pKa = 3.04
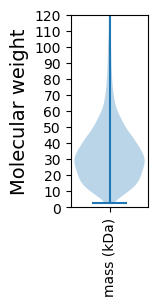
Molecular weight: 28.87 kDa
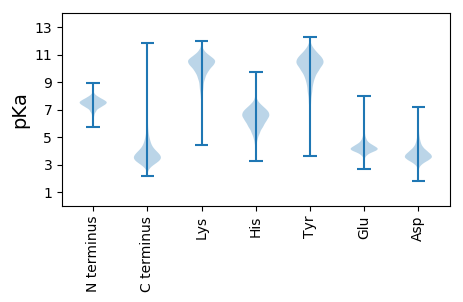
Isoelectric point according different methods:
Protein with the highest isoelectric point:
>tr|A0A5J6V9A1|A0A5J6V9A1_9MICO TetR/AcrR family transcriptional regulator OS=Ornithinimicrobium pratense OX=2593973 GN=FY030_14235 PE=4 SV=1
MM1 pKa = 7.69SKK3 pKa = 9.0RR4 pKa = 11.84TFQPNNRR11 pKa = 11.84RR12 pKa = 11.84RR13 pKa = 11.84AKK15 pKa = 9.97KK16 pKa = 9.33HH17 pKa = 4.25GFRR20 pKa = 11.84LRR22 pKa = 11.84MRR24 pKa = 11.84TRR26 pKa = 11.84AGRR29 pKa = 11.84AILNARR35 pKa = 11.84RR36 pKa = 11.84TKK38 pKa = 10.61GRR40 pKa = 11.84SSLSAA45 pKa = 3.62
MM1 pKa = 7.69SKK3 pKa = 9.0RR4 pKa = 11.84TFQPNNRR11 pKa = 11.84RR12 pKa = 11.84RR13 pKa = 11.84AKK15 pKa = 9.97KK16 pKa = 9.33HH17 pKa = 4.25GFRR20 pKa = 11.84LRR22 pKa = 11.84MRR24 pKa = 11.84TRR26 pKa = 11.84AGRR29 pKa = 11.84AILNARR35 pKa = 11.84RR36 pKa = 11.84TKK38 pKa = 10.61GRR40 pKa = 11.84SSLSAA45 pKa = 3.62
Molecular weight: 5.3 kDa
Isoelectric point according different methods:
Peptides (in silico digests for buttom-up proteomics)
Below you can find in silico digests of the whole proteome with Trypsin, Chymotrypsin, Trypsin+LysC, LysN, ArgC proteases suitable for different mass spec machines.| Try ESI |
 |
|---|
| ChTry ESI |
 |
|---|
| ArgC ESI |
 |
|---|
| LysN ESI |
 |
|---|
| TryLysC ESI |
 |
|---|
| Try MALDI |
 |
|---|
| ChTry MALDI |
 |
|---|
| ArgC MALDI |
 |
|---|
| LysN MALDI |
 |
|---|
| TryLysC MALDI |
 |
|---|
| Try LTQ |
 |
|---|
| ChTry LTQ |
 |
|---|
| ArgC LTQ |
 |
|---|
| LysN LTQ |
 |
|---|
| TryLysC LTQ |
 |
|---|
| Try MSlow |
 |
|---|
| ChTry MSlow |
 |
|---|
| ArgC MSlow |
 |
|---|
| LysN MSlow |
 |
|---|
| TryLysC MSlow |
 |
|---|
| Try MShigh |
 |
|---|
| ChTry MShigh |
 |
|---|
| ArgC MShigh |
 |
|---|
| LysN MShigh |
 |
|---|
| TryLysC MShigh |
 |
|---|
General Statistics
Number of major isoforms |
Number of additional isoforms |
Number of all proteins |
Number of amino acids |
Min. Seq. Length |
Max. Seq. Length |
Avg. Seq. Length |
Avg. Mol. Weight |
|---|---|---|---|---|---|---|---|
0 |
1029995 |
24 |
2025 |
334.8 |
35.89 |
Amino acid frequency
Ala |
Cys |
Asp |
Glu |
Phe |
Gly |
His |
Ile |
Lys |
Leu |
|---|---|---|---|---|---|---|---|---|---|
12.759 ± 0.06 | 0.651 ± 0.013 |
6.117 ± 0.04 | 6.07 ± 0.043 |
2.509 ± 0.026 | 9.479 ± 0.04 |
2.34 ± 0.021 | 3.35 ± 0.031 |
1.529 ± 0.025 | 10.686 ± 0.059 |
Met |
Asn |
Gln |
Pro |
Arg |
Ser |
Thr |
Val |
Trp |
Tyr |
|---|---|---|---|---|---|---|---|---|---|
1.933 ± 0.017 | 1.55 ± 0.021 |
5.905 ± 0.035 | 3.424 ± 0.021 |
7.791 ± 0.045 | 5.066 ± 0.028 |
6.023 ± 0.032 | 9.392 ± 0.04 |
1.602 ± 0.018 | 1.823 ± 0.021 |
Most of the basic statistics you can see at this page can be downloaded from this CSV file
Proteome-pI is available under Creative Commons Attribution-NoDerivs license, for more details see here
| Reference: Kozlowski LP. Proteome-pI 2.0: Proteome Isoelectric Point Database Update. Nucleic Acids Res. 2021, doi: 10.1093/nar/gkab944 | Contact: Lukasz P. Kozlowski |
