Arsenicitalea aurantiaca
Taxonomy: cellular organisms; Bacteria; Proteobacteria; Alphaproteobacteria; Hyphomicrobiales; Devosiaceae; Arsenicitalea
Average proteome isoelectric point is 6.27
Get precalculated fractions of proteins

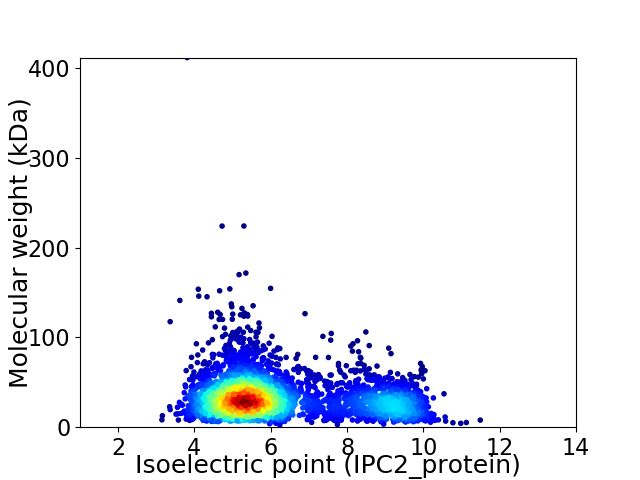
Virtual 2D-PAGE plot for 3476 proteins (isoelectric point calculated using IPC2_protein)
Get csv file with sequences according to given criteria:
* You can choose from 21 different methods for calculating isoelectric point
Summary statistics related to proteome-wise predictions


Protein with the lowest isoelectric point:
>tr|A0A433XF31|A0A433XF31_9RHIZ Outer membrane protein assembly factor BamA OS=Arsenicitalea aurantiaca OX=1783274 GN=bamA PE=3 SV=1
MM1 pKa = 7.8KK2 pKa = 9.48LTTKK6 pKa = 10.79LLAASAASVLMTASAFAADD25 pKa = 4.86LYY27 pKa = 11.62VPIEE31 pKa = 4.0QPYY34 pKa = 8.33VPEE37 pKa = 4.08VAAAAPLGWTGAYY50 pKa = 9.87VGVHH54 pKa = 6.5AGYY57 pKa = 10.61GWGQFDD63 pKa = 5.15LAGDD67 pKa = 4.06DD68 pKa = 3.46EE69 pKa = 5.16TTFFTPGDD77 pKa = 3.75SDD79 pKa = 3.67VDD81 pKa = 3.24GWLAGVQAGYY91 pKa = 10.38NVNLDD96 pKa = 3.64GVVLGIEE103 pKa = 4.73GDD105 pKa = 3.88IAWADD110 pKa = 3.79LNGSATIGTGDD121 pKa = 3.89DD122 pKa = 3.46AVTVSSNIDD131 pKa = 3.25WIGTIRR137 pKa = 11.84GRR139 pKa = 11.84VGFAADD145 pKa = 3.47AFLLYY150 pKa = 9.07GTAGVAFAGASMDD163 pKa = 3.78VAALEE168 pKa = 4.12PTEE171 pKa = 5.26AFSDD175 pKa = 4.3DD176 pKa = 3.7NVHH179 pKa = 6.07TGWVVGAGVEE189 pKa = 4.53TMVTDD194 pKa = 4.86NISLKK199 pKa = 10.85AEE201 pKa = 4.0YY202 pKa = 9.88LYY204 pKa = 10.87HH205 pKa = 7.72DD206 pKa = 5.23FGNEE210 pKa = 3.71TFSFDD215 pKa = 3.96DD216 pKa = 3.85TNATDD221 pKa = 4.0ASFNVQTAKK230 pKa = 10.41IGLNFHH236 pKa = 7.0FF237 pKa = 5.42
MM1 pKa = 7.8KK2 pKa = 9.48LTTKK6 pKa = 10.79LLAASAASVLMTASAFAADD25 pKa = 4.86LYY27 pKa = 11.62VPIEE31 pKa = 4.0QPYY34 pKa = 8.33VPEE37 pKa = 4.08VAAAAPLGWTGAYY50 pKa = 9.87VGVHH54 pKa = 6.5AGYY57 pKa = 10.61GWGQFDD63 pKa = 5.15LAGDD67 pKa = 4.06DD68 pKa = 3.46EE69 pKa = 5.16TTFFTPGDD77 pKa = 3.75SDD79 pKa = 3.67VDD81 pKa = 3.24GWLAGVQAGYY91 pKa = 10.38NVNLDD96 pKa = 3.64GVVLGIEE103 pKa = 4.73GDD105 pKa = 3.88IAWADD110 pKa = 3.79LNGSATIGTGDD121 pKa = 3.89DD122 pKa = 3.46AVTVSSNIDD131 pKa = 3.25WIGTIRR137 pKa = 11.84GRR139 pKa = 11.84VGFAADD145 pKa = 3.47AFLLYY150 pKa = 9.07GTAGVAFAGASMDD163 pKa = 3.78VAALEE168 pKa = 4.12PTEE171 pKa = 5.26AFSDD175 pKa = 4.3DD176 pKa = 3.7NVHH179 pKa = 6.07TGWVVGAGVEE189 pKa = 4.53TMVTDD194 pKa = 4.86NISLKK199 pKa = 10.85AEE201 pKa = 4.0YY202 pKa = 9.88LYY204 pKa = 10.87HH205 pKa = 7.72DD206 pKa = 5.23FGNEE210 pKa = 3.71TFSFDD215 pKa = 3.96DD216 pKa = 3.85TNATDD221 pKa = 4.0ASFNVQTAKK230 pKa = 10.41IGLNFHH236 pKa = 7.0FF237 pKa = 5.42
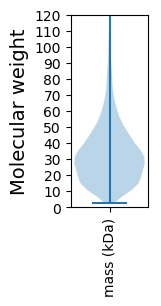
Molecular weight: 24.68 kDa
Isoelectric point according different methods:
Protein with the highest isoelectric point:
>tr|A0A433XF98|A0A433XF98_9RHIZ SMP-30/gluconolactonase/LRE family protein OS=Arsenicitalea aurantiaca OX=1783274 GN=EMQ25_06245 PE=4 SV=1
MM1 pKa = 7.77RR2 pKa = 11.84RR3 pKa = 11.84RR4 pKa = 11.84AQKK7 pKa = 9.89SPPRR11 pKa = 11.84AAHH14 pKa = 5.98HH15 pKa = 6.12RR16 pKa = 11.84RR17 pKa = 11.84GVRR20 pKa = 11.84PKK22 pKa = 10.18PKK24 pKa = 9.74RR25 pKa = 11.84APPLPRR31 pKa = 11.84TLPRR35 pKa = 11.84LRR37 pKa = 11.84RR38 pKa = 11.84AFARR42 pKa = 11.84WRR44 pKa = 11.84QSGMRR49 pKa = 11.84QRR51 pKa = 11.84HH52 pKa = 5.03PPWRR56 pKa = 11.84GTPPAQRR63 pKa = 11.84QRR65 pKa = 11.84GG66 pKa = 3.6
MM1 pKa = 7.77RR2 pKa = 11.84RR3 pKa = 11.84RR4 pKa = 11.84AQKK7 pKa = 9.89SPPRR11 pKa = 11.84AAHH14 pKa = 5.98HH15 pKa = 6.12RR16 pKa = 11.84RR17 pKa = 11.84GVRR20 pKa = 11.84PKK22 pKa = 10.18PKK24 pKa = 9.74RR25 pKa = 11.84APPLPRR31 pKa = 11.84TLPRR35 pKa = 11.84LRR37 pKa = 11.84RR38 pKa = 11.84AFARR42 pKa = 11.84WRR44 pKa = 11.84QSGMRR49 pKa = 11.84QRR51 pKa = 11.84HH52 pKa = 5.03PPWRR56 pKa = 11.84GTPPAQRR63 pKa = 11.84QRR65 pKa = 11.84GG66 pKa = 3.6
Molecular weight: 7.91 kDa
Isoelectric point according different methods:
Peptides (in silico digests for buttom-up proteomics)
Below you can find in silico digests of the whole proteome with Trypsin, Chymotrypsin, Trypsin+LysC, LysN, ArgC proteases suitable for different mass spec machines.| Try ESI |
 |
|---|
| ChTry ESI |
 |
|---|
| ArgC ESI |
 |
|---|
| LysN ESI |
 |
|---|
| TryLysC ESI |
 |
|---|
| Try MALDI |
 |
|---|
| ChTry MALDI |
 |
|---|
| ArgC MALDI |
 |
|---|
| LysN MALDI |
 |
|---|
| TryLysC MALDI |
 |
|---|
| Try LTQ |
 |
|---|
| ChTry LTQ |
 |
|---|
| ArgC LTQ |
 |
|---|
| LysN LTQ |
 |
|---|
| TryLysC LTQ |
 |
|---|
| Try MSlow |
 |
|---|
| ChTry MSlow |
 |
|---|
| ArgC MSlow |
 |
|---|
| LysN MSlow |
 |
|---|
| TryLysC MSlow |
 |
|---|
| Try MShigh |
 |
|---|
| ChTry MShigh |
 |
|---|
| ArgC MShigh |
 |
|---|
| LysN MShigh |
 |
|---|
| TryLysC MShigh |
 |
|---|
General Statistics
Number of major isoforms |
Number of additional isoforms |
Number of all proteins |
Number of amino acids |
Min. Seq. Length |
Max. Seq. Length |
Avg. Seq. Length |
Avg. Mol. Weight |
|---|---|---|---|---|---|---|---|
0 |
1110746 |
20 |
3988 |
319.5 |
34.52 |
Amino acid frequency
Ala |
Cys |
Asp |
Glu |
Phe |
Gly |
His |
Ile |
Lys |
Leu |
|---|---|---|---|---|---|---|---|---|---|
12.891 ± 0.059 | 0.694 ± 0.012 |
5.515 ± 0.039 | 6.08 ± 0.04 |
3.769 ± 0.03 | 8.967 ± 0.043 |
1.976 ± 0.019 | 5.474 ± 0.029 |
2.333 ± 0.029 | 10.499 ± 0.048 |
Met |
Asn |
Gln |
Pro |
Arg |
Ser |
Thr |
Val |
Trp |
Tyr |
|---|---|---|---|---|---|---|---|---|---|
2.489 ± 0.02 | 2.439 ± 0.021 |
5.307 ± 0.033 | 2.885 ± 0.023 |
7.34 ± 0.041 | 5.188 ± 0.028 |
5.319 ± 0.026 | 7.439 ± 0.037 |
1.256 ± 0.017 | 2.137 ± 0.022 |
Most of the basic statistics you can see at this page can be downloaded from this CSV file
Proteome-pI is available under Creative Commons Attribution-NoDerivs license, for more details see here
| Reference: Kozlowski LP. Proteome-pI 2.0: Proteome Isoelectric Point Database Update. Nucleic Acids Res. 2021, doi: 10.1093/nar/gkab944 | Contact: Lukasz P. Kozlowski |
