Corynebacterium freneyi DNF00450
Taxonomy: cellular organisms; Bacteria; Terrabacteria group; Actinobacteria; Actinomycetia; Corynebacteriales; Corynebacteriaceae; Corynebacterium; Corynebacterium freneyi
Average proteome isoelectric point is 5.73
Get precalculated fractions of proteins

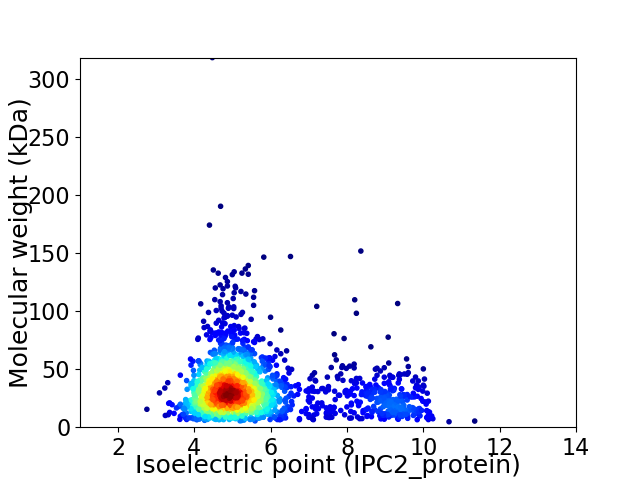
Virtual 2D-PAGE plot for 1898 proteins (isoelectric point calculated using IPC2_protein)
Get csv file with sequences according to given criteria:
* You can choose from 21 different methods for calculating isoelectric point
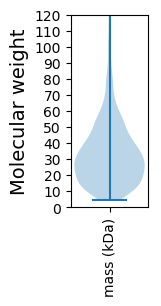
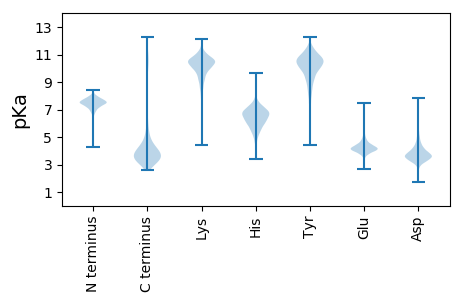
Summary statistics related to proteome-wise predictions


Protein with the lowest isoelectric point:
>tr|A0A095ZBY3|A0A095ZBY3_9CORY Queuine tRNA-ribosyltransferase OS=Corynebacterium freneyi DNF00450 OX=1287475 GN=tgt PE=3 SV=1
MM1 pKa = 7.28KK2 pKa = 10.35RR3 pKa = 11.84SNTLAALVLTSTLALTACSDD23 pKa = 3.52ATDD26 pKa = 3.89NSDD29 pKa = 4.51DD30 pKa = 4.35AGTTSTTTATAEE42 pKa = 4.19TNEE45 pKa = 4.09THH47 pKa = 7.0QEE49 pKa = 3.95DD50 pKa = 4.6TTTADD55 pKa = 4.03DD56 pKa = 4.51GGHH59 pKa = 6.68DD60 pKa = 3.93MEE62 pKa = 6.45HH63 pKa = 7.26PEE65 pKa = 5.16DD66 pKa = 4.54GGPPPEE72 pKa = 5.59GITEE76 pKa = 4.31ATDD79 pKa = 3.12PTYY82 pKa = 10.54PVGSEE87 pKa = 3.95VMLTADD93 pKa = 4.71HH94 pKa = 6.35MPGMDD99 pKa = 3.56GAQATISGAFDD110 pKa = 3.15TTTYY114 pKa = 10.32SVSYY118 pKa = 9.4TPTDD122 pKa = 3.06GGEE125 pKa = 4.04PVTDD129 pKa = 3.63HH130 pKa = 6.41RR131 pKa = 11.84WVVHH135 pKa = 6.18EE136 pKa = 4.37EE137 pKa = 3.87LVDD140 pKa = 4.11PGEE143 pKa = 4.35APLPGGTEE151 pKa = 3.84VVLNAEE157 pKa = 4.93HH158 pKa = 6.23MPGMQGATATIDD170 pKa = 3.31YY171 pKa = 7.46STQEE175 pKa = 3.84TVYY178 pKa = 10.22MVDD181 pKa = 2.89IDD183 pKa = 3.97TGEE186 pKa = 3.84MTMINHH192 pKa = 6.4KK193 pKa = 9.56WVTEE197 pKa = 4.09SEE199 pKa = 4.23IQPAEE204 pKa = 3.8
MM1 pKa = 7.28KK2 pKa = 10.35RR3 pKa = 11.84SNTLAALVLTSTLALTACSDD23 pKa = 3.52ATDD26 pKa = 3.89NSDD29 pKa = 4.51DD30 pKa = 4.35AGTTSTTTATAEE42 pKa = 4.19TNEE45 pKa = 4.09THH47 pKa = 7.0QEE49 pKa = 3.95DD50 pKa = 4.6TTTADD55 pKa = 4.03DD56 pKa = 4.51GGHH59 pKa = 6.68DD60 pKa = 3.93MEE62 pKa = 6.45HH63 pKa = 7.26PEE65 pKa = 5.16DD66 pKa = 4.54GGPPPEE72 pKa = 5.59GITEE76 pKa = 4.31ATDD79 pKa = 3.12PTYY82 pKa = 10.54PVGSEE87 pKa = 3.95VMLTADD93 pKa = 4.71HH94 pKa = 6.35MPGMDD99 pKa = 3.56GAQATISGAFDD110 pKa = 3.15TTTYY114 pKa = 10.32SVSYY118 pKa = 9.4TPTDD122 pKa = 3.06GGEE125 pKa = 4.04PVTDD129 pKa = 3.63HH130 pKa = 6.41RR131 pKa = 11.84WVVHH135 pKa = 6.18EE136 pKa = 4.37EE137 pKa = 3.87LVDD140 pKa = 4.11PGEE143 pKa = 4.35APLPGGTEE151 pKa = 3.84VVLNAEE157 pKa = 4.93HH158 pKa = 6.23MPGMQGATATIDD170 pKa = 3.31YY171 pKa = 7.46STQEE175 pKa = 3.84TVYY178 pKa = 10.22MVDD181 pKa = 2.89IDD183 pKa = 3.97TGEE186 pKa = 3.84MTMINHH192 pKa = 6.4KK193 pKa = 9.56WVTEE197 pKa = 4.09SEE199 pKa = 4.23IQPAEE204 pKa = 3.8
Molecular weight: 21.51 kDa
Isoelectric point according different methods:
Protein with the highest isoelectric point:
>tr|A0A095Y4F5|A0A095Y4F5_9CORY Branched-chain amino acid ABC transporter permease OS=Corynebacterium freneyi DNF00450 OX=1287475 GN=HMPREF1650_05260 PE=4 SV=1
MM1 pKa = 7.69SKK3 pKa = 9.0RR4 pKa = 11.84TFQPNNRR11 pKa = 11.84RR12 pKa = 11.84RR13 pKa = 11.84ARR15 pKa = 11.84VHH17 pKa = 5.99GFRR20 pKa = 11.84TRR22 pKa = 11.84MRR24 pKa = 11.84TRR26 pKa = 11.84SGRR29 pKa = 11.84AVVAARR35 pKa = 11.84RR36 pKa = 11.84NKK38 pKa = 9.36GRR40 pKa = 11.84ARR42 pKa = 11.84LSAA45 pKa = 3.91
MM1 pKa = 7.69SKK3 pKa = 9.0RR4 pKa = 11.84TFQPNNRR11 pKa = 11.84RR12 pKa = 11.84RR13 pKa = 11.84ARR15 pKa = 11.84VHH17 pKa = 5.99GFRR20 pKa = 11.84TRR22 pKa = 11.84MRR24 pKa = 11.84TRR26 pKa = 11.84SGRR29 pKa = 11.84AVVAARR35 pKa = 11.84RR36 pKa = 11.84NKK38 pKa = 9.36GRR40 pKa = 11.84ARR42 pKa = 11.84LSAA45 pKa = 3.91
Molecular weight: 5.3 kDa
Isoelectric point according different methods:
Peptides (in silico digests for buttom-up proteomics)
Below you can find in silico digests of the whole proteome with Trypsin, Chymotrypsin, Trypsin+LysC, LysN, ArgC proteases suitable for different mass spec machines.| Try ESI |
 |
|---|
| ChTry ESI |
 |
|---|
| ArgC ESI |
 |
|---|
| LysN ESI |
 |
|---|
| TryLysC ESI |
 |
|---|
| Try MALDI |
 |
|---|
| ChTry MALDI |
 |
|---|
| ArgC MALDI |
 |
|---|
| LysN MALDI |
 |
|---|
| TryLysC MALDI |
 |
|---|
| Try LTQ |
 |
|---|
| ChTry LTQ |
 |
|---|
| ArgC LTQ |
 |
|---|
| LysN LTQ |
 |
|---|
| TryLysC LTQ |
 |
|---|
| Try MSlow |
 |
|---|
| ChTry MSlow |
 |
|---|
| ArgC MSlow |
 |
|---|
| LysN MSlow |
 |
|---|
| TryLysC MSlow |
 |
|---|
| Try MShigh |
 |
|---|
| ChTry MShigh |
 |
|---|
| ArgC MShigh |
 |
|---|
| LysN MShigh |
 |
|---|
| TryLysC MShigh |
 |
|---|
General Statistics
Number of major isoforms |
Number of additional isoforms |
Number of all proteins |
Number of amino acids |
Min. Seq. Length |
Max. Seq. Length |
Avg. Seq. Length |
Avg. Mol. Weight |
|---|---|---|---|---|---|---|---|
0 |
622226 |
40 |
3067 |
327.8 |
35.19 |
Amino acid frequency
Ala |
Cys |
Asp |
Glu |
Phe |
Gly |
His |
Ile |
Lys |
Leu |
|---|---|---|---|---|---|---|---|---|---|
12.751 ± 0.087 | 0.714 ± 0.016 |
7.137 ± 0.058 | 6.314 ± 0.059 |
2.913 ± 0.034 | 9.398 ± 0.055 |
2.097 ± 0.027 | 4.51 ± 0.039 |
2.712 ± 0.046 | 9.142 ± 0.059 |
Met |
Asn |
Gln |
Pro |
Arg |
Ser |
Thr |
Val |
Trp |
Tyr |
|---|---|---|---|---|---|---|---|---|---|
2.277 ± 0.024 | 2.284 ± 0.03 |
5.358 ± 0.043 | 2.525 ± 0.033 |
7.148 ± 0.056 | 5.125 ± 0.04 |
5.689 ± 0.037 | 8.575 ± 0.057 |
1.405 ± 0.027 | 1.921 ± 0.029 |
Most of the basic statistics you can see at this page can be downloaded from this CSV file
Proteome-pI is available under Creative Commons Attribution-NoDerivs license, for more details see here
| Reference: Kozlowski LP. Proteome-pI 2.0: Proteome Isoelectric Point Database Update. Nucleic Acids Res. 2021, doi: 10.1093/nar/gkab944 | Contact: Lukasz P. Kozlowski |
