Sulfitobacter sabulilitoris
Taxonomy: cellular organisms; Bacteria; Proteobacteria; Alphaproteobacteria; Rhodobacterales; Roseobacteraceae; Sulfitobacter
Average proteome isoelectric point is 6.22
Get precalculated fractions of proteins

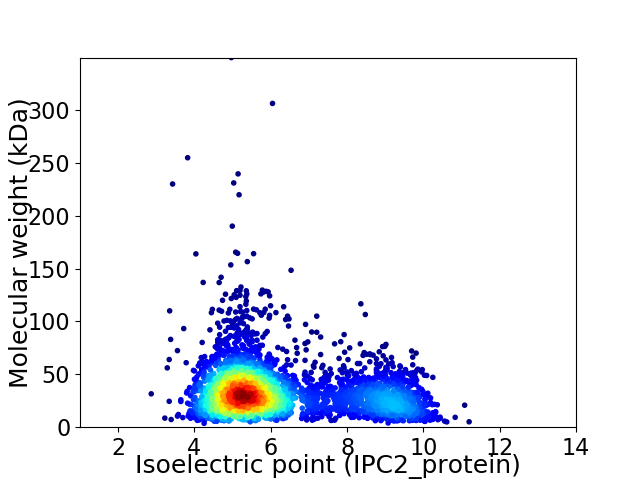
Virtual 2D-PAGE plot for 3675 proteins (isoelectric point calculated using IPC2_protein)
Get csv file with sequences according to given criteria:
* You can choose from 21 different methods for calculating isoelectric point
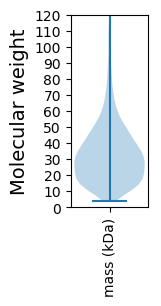
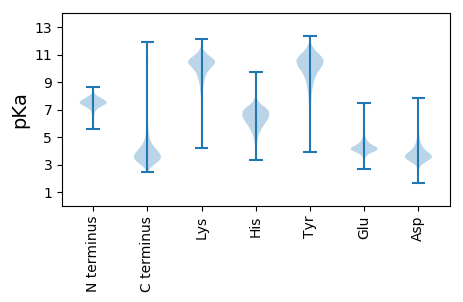
Summary statistics related to proteome-wise predictions


Protein with the lowest isoelectric point:
>tr|A0A5S3Q331|A0A5S3Q331_9RHOB DUF2842 domain-containing protein OS=Sulfitobacter sabulilitoris OX=2562655 GN=FDT80_16365 PE=4 SV=1
MM1 pKa = 7.12QLADD5 pKa = 3.54YY6 pKa = 9.91FYY8 pKa = 10.95GYY10 pKa = 10.64GFAGDD15 pKa = 4.39YY16 pKa = 7.58FTGAAIDD23 pKa = 3.9LSRR26 pKa = 11.84EE27 pKa = 3.99GGGTQFLVGGSASQQSNPGNEE48 pKa = 4.06FHH50 pKa = 6.64FTPVAGGLAYY60 pKa = 10.38FQGNGFLNPSTGTVNSVTVDD80 pKa = 3.47PLGGNTARR88 pKa = 11.84FGIQGFSQNLATMQTATWAFYY109 pKa = 7.64EE110 pKa = 4.32TNIFNGNDD118 pKa = 3.34TMTGSYY124 pKa = 10.7QNDD127 pKa = 3.57RR128 pKa = 11.84LVGYY132 pKa = 10.51AGDD135 pKa = 4.63DD136 pKa = 3.44VLFDD140 pKa = 4.08GKK142 pKa = 11.05GDD144 pKa = 3.44KK145 pKa = 10.48KK146 pKa = 10.82NYY148 pKa = 8.51NVSVTPYY155 pKa = 9.85PDD157 pKa = 3.64PTPSTLRR164 pKa = 11.84NPGEE168 pKa = 4.44TVSNTSFFVDD178 pKa = 4.82DD179 pKa = 4.95GDD181 pKa = 4.72DD182 pKa = 3.78VLDD185 pKa = 4.47GEE187 pKa = 4.95AGNDD191 pKa = 3.46RR192 pKa = 11.84LDD194 pKa = 3.78GGTGNDD200 pKa = 3.98LLIGGSGNDD209 pKa = 3.75EE210 pKa = 3.96LWGGGTGNDD219 pKa = 3.83TLNGGTGNDD228 pKa = 3.79TLHH231 pKa = 6.68GGSGIDD237 pKa = 2.98TAVFNVASTDD247 pKa = 3.14ITGG250 pKa = 3.21
MM1 pKa = 7.12QLADD5 pKa = 3.54YY6 pKa = 9.91FYY8 pKa = 10.95GYY10 pKa = 10.64GFAGDD15 pKa = 4.39YY16 pKa = 7.58FTGAAIDD23 pKa = 3.9LSRR26 pKa = 11.84EE27 pKa = 3.99GGGTQFLVGGSASQQSNPGNEE48 pKa = 4.06FHH50 pKa = 6.64FTPVAGGLAYY60 pKa = 10.38FQGNGFLNPSTGTVNSVTVDD80 pKa = 3.47PLGGNTARR88 pKa = 11.84FGIQGFSQNLATMQTATWAFYY109 pKa = 7.64EE110 pKa = 4.32TNIFNGNDD118 pKa = 3.34TMTGSYY124 pKa = 10.7QNDD127 pKa = 3.57RR128 pKa = 11.84LVGYY132 pKa = 10.51AGDD135 pKa = 4.63DD136 pKa = 3.44VLFDD140 pKa = 4.08GKK142 pKa = 11.05GDD144 pKa = 3.44KK145 pKa = 10.48KK146 pKa = 10.82NYY148 pKa = 8.51NVSVTPYY155 pKa = 9.85PDD157 pKa = 3.64PTPSTLRR164 pKa = 11.84NPGEE168 pKa = 4.44TVSNTSFFVDD178 pKa = 4.82DD179 pKa = 4.95GDD181 pKa = 4.72DD182 pKa = 3.78VLDD185 pKa = 4.47GEE187 pKa = 4.95AGNDD191 pKa = 3.46RR192 pKa = 11.84LDD194 pKa = 3.78GGTGNDD200 pKa = 3.98LLIGGSGNDD209 pKa = 3.75EE210 pKa = 3.96LWGGGTGNDD219 pKa = 3.83TLNGGTGNDD228 pKa = 3.79TLHH231 pKa = 6.68GGSGIDD237 pKa = 2.98TAVFNVASTDD247 pKa = 3.14ITGG250 pKa = 3.21
Molecular weight: 25.9 kDa
Isoelectric point according different methods:
Protein with the highest isoelectric point:
>tr|A0A5S3P7Z1|A0A5S3P7Z1_9RHOB PAS domain S-box protein OS=Sulfitobacter sabulilitoris OX=2562655 GN=FDT80_17640 PE=4 SV=1
MM1 pKa = 7.45KK2 pKa = 9.61RR3 pKa = 11.84TFQPSNLVRR12 pKa = 11.84KK13 pKa = 9.18RR14 pKa = 11.84RR15 pKa = 11.84HH16 pKa = 4.42GFRR19 pKa = 11.84ARR21 pKa = 11.84MATKK25 pKa = 10.37AGRR28 pKa = 11.84KK29 pKa = 8.81IINARR34 pKa = 11.84RR35 pKa = 11.84AQGRR39 pKa = 11.84KK40 pKa = 9.34SLSAA44 pKa = 3.83
MM1 pKa = 7.45KK2 pKa = 9.61RR3 pKa = 11.84TFQPSNLVRR12 pKa = 11.84KK13 pKa = 9.18RR14 pKa = 11.84RR15 pKa = 11.84HH16 pKa = 4.42GFRR19 pKa = 11.84ARR21 pKa = 11.84MATKK25 pKa = 10.37AGRR28 pKa = 11.84KK29 pKa = 8.81IINARR34 pKa = 11.84RR35 pKa = 11.84AQGRR39 pKa = 11.84KK40 pKa = 9.34SLSAA44 pKa = 3.83
Molecular weight: 5.11 kDa
Isoelectric point according different methods:
Peptides (in silico digests for buttom-up proteomics)
Below you can find in silico digests of the whole proteome with Trypsin, Chymotrypsin, Trypsin+LysC, LysN, ArgC proteases suitable for different mass spec machines.| Try ESI |
 |
|---|
| ChTry ESI |
 |
|---|
| ArgC ESI |
 |
|---|
| LysN ESI |
 |
|---|
| TryLysC ESI |
 |
|---|
| Try MALDI |
 |
|---|
| ChTry MALDI |
 |
|---|
| ArgC MALDI |
 |
|---|
| LysN MALDI |
 |
|---|
| TryLysC MALDI |
 |
|---|
| Try LTQ |
 |
|---|
| ChTry LTQ |
 |
|---|
| ArgC LTQ |
 |
|---|
| LysN LTQ |
 |
|---|
| TryLysC LTQ |
 |
|---|
| Try MSlow |
 |
|---|
| ChTry MSlow |
 |
|---|
| ArgC MSlow |
 |
|---|
| LysN MSlow |
 |
|---|
| TryLysC MSlow |
 |
|---|
| Try MShigh |
 |
|---|
| ChTry MShigh |
 |
|---|
| ArgC MShigh |
 |
|---|
| LysN MShigh |
 |
|---|
| TryLysC MShigh |
 |
|---|
General Statistics
Number of major isoforms |
Number of additional isoforms |
Number of all proteins |
Number of amino acids |
Min. Seq. Length |
Max. Seq. Length |
Avg. Seq. Length |
Avg. Mol. Weight |
|---|---|---|---|---|---|---|---|
0 |
1186263 |
33 |
3284 |
322.8 |
34.93 |
Amino acid frequency
Ala |
Cys |
Asp |
Glu |
Phe |
Gly |
His |
Ile |
Lys |
Leu |
|---|---|---|---|---|---|---|---|---|---|
12.751 ± 0.049 | 0.886 ± 0.012 |
6.517 ± 0.039 | 5.152 ± 0.037 |
3.6 ± 0.022 | 8.817 ± 0.046 |
2.115 ± 0.02 | 5.072 ± 0.028 |
2.852 ± 0.028 | 9.903 ± 0.047 |
Met |
Asn |
Gln |
Pro |
Arg |
Ser |
Thr |
Val |
Trp |
Tyr |
|---|---|---|---|---|---|---|---|---|---|
2.842 ± 0.024 | 2.438 ± 0.024 |
5.179 ± 0.035 | 3.276 ± 0.021 |
7.02 ± 0.042 | 4.977 ± 0.028 |
5.668 ± 0.029 | 7.378 ± 0.032 |
1.368 ± 0.017 | 2.188 ± 0.018 |
Most of the basic statistics you can see at this page can be downloaded from this CSV file
Proteome-pI is available under Creative Commons Attribution-NoDerivs license, for more details see here
| Reference: Kozlowski LP. Proteome-pI 2.0: Proteome Isoelectric Point Database Update. Nucleic Acids Res. 2021, doi: 10.1093/nar/gkab944 | Contact: Lukasz P. Kozlowski |
