Mycolicibacterium chitae (Mycobacterium chitae)
Taxonomy: cellular organisms; Bacteria; Terrabacteria group; Actinobacteria; Actinomycetia; Corynebacteriales;
Average proteome isoelectric point is 5.88
Get precalculated fractions of proteins

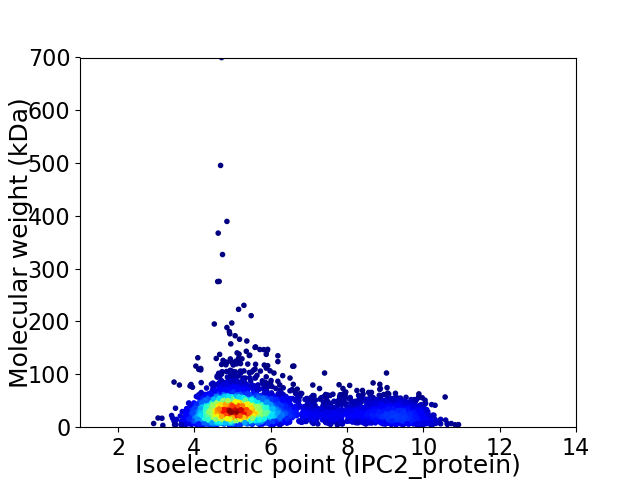
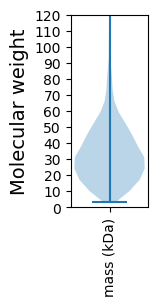
Virtual 2D-PAGE plot for 5110 proteins (isoelectric point calculated using IPC2_protein)
Get csv file with sequences according to given criteria:
* You can choose from 21 different methods for calculating isoelectric point
Summary statistics related to proteome-wise predictions


Protein with the lowest isoelectric point:
>tr|A0A448HYH8|A0A448HYH8_MYCCI Acyl CoA:acetate/3-ketoacid CoA transferase subunit alpha OS=Mycolicibacterium chitae OX=1792 GN=gctA PE=4 SV=1
MM1 pKa = 7.28FSARR5 pKa = 11.84CSVALAALVAALVAVVGCGGGQAEE29 pKa = 4.7SVGLPDD35 pKa = 4.54PEE37 pKa = 4.23PEE39 pKa = 3.72RR40 pKa = 11.84TEE42 pKa = 3.9RR43 pKa = 11.84VVVPNVPTEE52 pKa = 3.96TGEE55 pKa = 4.04MFVVYY60 pKa = 9.8EE61 pKa = 4.14DD62 pKa = 4.24AEE64 pKa = 4.35SPEE67 pKa = 4.06AVRR70 pKa = 11.84GRR72 pKa = 11.84EE73 pKa = 3.99LLTEE77 pKa = 4.37ANLLEE82 pKa = 4.41EE83 pKa = 5.09LADD86 pKa = 4.24DD87 pKa = 4.22VNAMLLLPVDD97 pKa = 3.72VPVNGRR103 pKa = 11.84QCDD106 pKa = 3.3EE107 pKa = 4.54ANAYY111 pKa = 7.69WSPSEE116 pKa = 3.81QAMTICYY123 pKa = 9.67EE124 pKa = 3.99DD125 pKa = 4.39AEE127 pKa = 4.18LSEE130 pKa = 5.42RR131 pKa = 11.84IFEE134 pKa = 4.3EE135 pKa = 4.8AGEE138 pKa = 4.28EE139 pKa = 4.06DD140 pKa = 4.26PLAATLGAEE149 pKa = 3.9RR150 pKa = 11.84ATFYY154 pKa = 11.07HH155 pKa = 6.5EE156 pKa = 5.02LGHH159 pKa = 7.19AVIDD163 pKa = 4.85LYY165 pKa = 11.34DD166 pKa = 3.68LPFTGRR172 pKa = 11.84EE173 pKa = 3.74EE174 pKa = 4.79DD175 pKa = 4.27VADD178 pKa = 3.64QLAAVLLLGAGDD190 pKa = 5.43DD191 pKa = 4.1GTADD195 pKa = 3.74PEE197 pKa = 4.27NVEE200 pKa = 4.01AAQAYY205 pKa = 9.75ALMFQGYY212 pKa = 8.57SEE214 pKa = 4.16QDD216 pKa = 2.82GGGAEE221 pKa = 4.91EE222 pKa = 4.41FPFWDD227 pKa = 3.23VHH229 pKa = 6.11EE230 pKa = 4.69YY231 pKa = 11.31DD232 pKa = 3.98LARR235 pKa = 11.84MYY237 pKa = 11.12NFQCWIYY244 pKa = 11.14GSDD247 pKa = 3.69PEE249 pKa = 4.86NNAFMVDD256 pKa = 3.78DD257 pKa = 4.52GFVPDD262 pKa = 4.82EE263 pKa = 4.56RR264 pKa = 11.84ADD266 pKa = 3.59SCEE269 pKa = 4.18GEE271 pKa = 4.29FDD273 pKa = 3.29RR274 pKa = 11.84MSRR277 pKa = 11.84AWYY280 pKa = 10.18EE281 pKa = 3.52MLEE284 pKa = 3.81PHH286 pKa = 6.71LRR288 pKa = 11.84DD289 pKa = 3.32EE290 pKa = 4.51
MM1 pKa = 7.28FSARR5 pKa = 11.84CSVALAALVAALVAVVGCGGGQAEE29 pKa = 4.7SVGLPDD35 pKa = 4.54PEE37 pKa = 4.23PEE39 pKa = 3.72RR40 pKa = 11.84TEE42 pKa = 3.9RR43 pKa = 11.84VVVPNVPTEE52 pKa = 3.96TGEE55 pKa = 4.04MFVVYY60 pKa = 9.8EE61 pKa = 4.14DD62 pKa = 4.24AEE64 pKa = 4.35SPEE67 pKa = 4.06AVRR70 pKa = 11.84GRR72 pKa = 11.84EE73 pKa = 3.99LLTEE77 pKa = 4.37ANLLEE82 pKa = 4.41EE83 pKa = 5.09LADD86 pKa = 4.24DD87 pKa = 4.22VNAMLLLPVDD97 pKa = 3.72VPVNGRR103 pKa = 11.84QCDD106 pKa = 3.3EE107 pKa = 4.54ANAYY111 pKa = 7.69WSPSEE116 pKa = 3.81QAMTICYY123 pKa = 9.67EE124 pKa = 3.99DD125 pKa = 4.39AEE127 pKa = 4.18LSEE130 pKa = 5.42RR131 pKa = 11.84IFEE134 pKa = 4.3EE135 pKa = 4.8AGEE138 pKa = 4.28EE139 pKa = 4.06DD140 pKa = 4.26PLAATLGAEE149 pKa = 3.9RR150 pKa = 11.84ATFYY154 pKa = 11.07HH155 pKa = 6.5EE156 pKa = 5.02LGHH159 pKa = 7.19AVIDD163 pKa = 4.85LYY165 pKa = 11.34DD166 pKa = 3.68LPFTGRR172 pKa = 11.84EE173 pKa = 3.74EE174 pKa = 4.79DD175 pKa = 4.27VADD178 pKa = 3.64QLAAVLLLGAGDD190 pKa = 5.43DD191 pKa = 4.1GTADD195 pKa = 3.74PEE197 pKa = 4.27NVEE200 pKa = 4.01AAQAYY205 pKa = 9.75ALMFQGYY212 pKa = 8.57SEE214 pKa = 4.16QDD216 pKa = 2.82GGGAEE221 pKa = 4.91EE222 pKa = 4.41FPFWDD227 pKa = 3.23VHH229 pKa = 6.11EE230 pKa = 4.69YY231 pKa = 11.31DD232 pKa = 3.98LARR235 pKa = 11.84MYY237 pKa = 11.12NFQCWIYY244 pKa = 11.14GSDD247 pKa = 3.69PEE249 pKa = 4.86NNAFMVDD256 pKa = 3.78DD257 pKa = 4.52GFVPDD262 pKa = 4.82EE263 pKa = 4.56RR264 pKa = 11.84ADD266 pKa = 3.59SCEE269 pKa = 4.18GEE271 pKa = 4.29FDD273 pKa = 3.29RR274 pKa = 11.84MSRR277 pKa = 11.84AWYY280 pKa = 10.18EE281 pKa = 3.52MLEE284 pKa = 3.81PHH286 pKa = 6.71LRR288 pKa = 11.84DD289 pKa = 3.32EE290 pKa = 4.51
Molecular weight: 31.9 kDa
Isoelectric point according different methods:
Protein with the highest isoelectric point:
>tr|A0A448I0B2|A0A448I0B2_MYCCI Metalloendopeptidase-like membrane protein OS=Mycolicibacterium chitae OX=1792 GN=lytM_1 PE=4 SV=1
MM1 pKa = 7.53PPGWPRR7 pKa = 11.84RR8 pKa = 11.84WLTRR12 pKa = 11.84ALVLGTATRR21 pKa = 11.84AGRR24 pKa = 11.84GAVVPASAALPFVFRR39 pKa = 11.84GAVNTLAGG47 pKa = 3.77
MM1 pKa = 7.53PPGWPRR7 pKa = 11.84RR8 pKa = 11.84WLTRR12 pKa = 11.84ALVLGTATRR21 pKa = 11.84AGRR24 pKa = 11.84GAVVPASAALPFVFRR39 pKa = 11.84GAVNTLAGG47 pKa = 3.77
Molecular weight: 4.89 kDa
Isoelectric point according different methods:
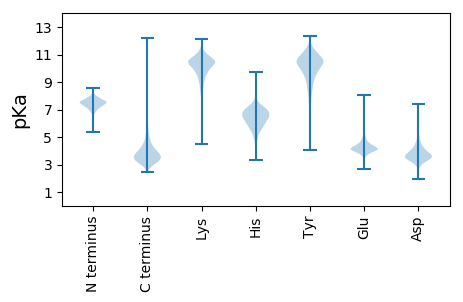
Peptides (in silico digests for buttom-up proteomics)
Below you can find in silico digests of the whole proteome with Trypsin, Chymotrypsin, Trypsin+LysC, LysN, ArgC proteases suitable for different mass spec machines.| Try ESI |
 |
|---|
| ChTry ESI |
 |
|---|
| ArgC ESI |
 |
|---|
| LysN ESI |
 |
|---|
| TryLysC ESI |
 |
|---|
| Try MALDI |
 |
|---|
| ChTry MALDI |
 |
|---|
| ArgC MALDI |
 |
|---|
| LysN MALDI |
 |
|---|
| TryLysC MALDI |
 |
|---|
| Try LTQ |
 |
|---|
| ChTry LTQ |
 |
|---|
| ArgC LTQ |
 |
|---|
| LysN LTQ |
 |
|---|
| TryLysC LTQ |
 |
|---|
| Try MSlow |
 |
|---|
| ChTry MSlow |
 |
|---|
| ArgC MSlow |
 |
|---|
| LysN MSlow |
 |
|---|
| TryLysC MSlow |
 |
|---|
| Try MShigh |
 |
|---|
| ChTry MShigh |
 |
|---|
| ArgC MShigh |
 |
|---|
| LysN MShigh |
 |
|---|
| TryLysC MShigh |
 |
|---|
General Statistics
Number of major isoforms |
Number of additional isoforms |
Number of all proteins |
Number of amino acids |
Min. Seq. Length |
Max. Seq. Length |
Avg. Seq. Length |
Avg. Mol. Weight |
|---|---|---|---|---|---|---|---|
0 |
1670072 |
29 |
6531 |
326.8 |
35.07 |
Amino acid frequency
Ala |
Cys |
Asp |
Glu |
Phe |
Gly |
His |
Ile |
Lys |
Leu |
|---|---|---|---|---|---|---|---|---|---|
13.254 ± 0.055 | 0.781 ± 0.01 |
6.372 ± 0.028 | 5.544 ± 0.029 |
3.05 ± 0.019 | 8.858 ± 0.033 |
2.124 ± 0.016 | 4.226 ± 0.022 |
2.13 ± 0.023 | 9.937 ± 0.036 |
Met |
Asn |
Gln |
Pro |
Arg |
Ser |
Thr |
Val |
Trp |
Tyr |
|---|---|---|---|---|---|---|---|---|---|
2.019 ± 0.014 | 2.192 ± 0.017 |
5.893 ± 0.033 | 2.999 ± 0.016 |
7.198 ± 0.031 | 5.129 ± 0.018 |
6.043 ± 0.022 | 8.667 ± 0.034 |
1.464 ± 0.014 | 2.122 ± 0.014 |
Most of the basic statistics you can see at this page can be downloaded from this CSV file
Proteome-pI is available under Creative Commons Attribution-NoDerivs license, for more details see here
| Reference: Kozlowski LP. Proteome-pI 2.0: Proteome Isoelectric Point Database Update. Nucleic Acids Res. 2021, doi: 10.1093/nar/gkab944 | Contact: Lukasz P. Kozlowski |
