Histidinibacterium sp. 176SS1-4
Taxonomy: cellular organisms; Bacteria; Proteobacteria; Alphaproteobacteria; Rhodobacterales; Rhodobacteraceae; Histidinibacterium; unclassified Histidinibacterium
Average proteome isoelectric point is 5.97
Get precalculated fractions of proteins

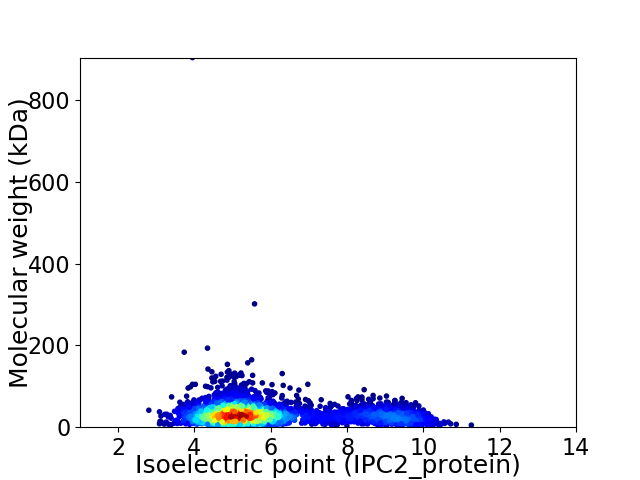
Virtual 2D-PAGE plot for 3759 proteins (isoelectric point calculated using IPC2_protein)
Get csv file with sequences according to given criteria:
* You can choose from 21 different methods for calculating isoelectric point
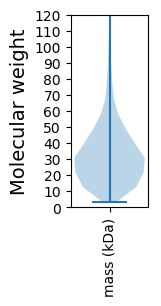
Summary statistics related to proteome-wise predictions


Protein with the lowest isoelectric point:
>tr|A0A5J5GE64|A0A5J5GE64_9RHOB Cadmium-translocating P-type ATPase OS=Histidinibacterium sp. 176SS1-4 OX=2613962 GN=cadA PE=3 SV=1
MM1 pKa = 7.14TLKK4 pKa = 10.66PLTILGALAAGTVALPASAQEE25 pKa = 4.27YY26 pKa = 10.59CGGLSSGAWIGGNEE40 pKa = 4.14ANSDD44 pKa = 3.26IGSAEE49 pKa = 4.02TFRR52 pKa = 11.84EE53 pKa = 3.82QLALVLLGNAHH64 pKa = 6.44TSLFSLSEE72 pKa = 3.95AASVRR77 pKa = 11.84LEE79 pKa = 3.91AEE81 pKa = 3.85ARR83 pKa = 11.84GQGDD87 pKa = 3.5PVIEE91 pKa = 4.19VLDD94 pKa = 4.06GEE96 pKa = 4.81GGVVATDD103 pKa = 3.87DD104 pKa = 3.95DD105 pKa = 4.44SGGGVSSAALVALEE119 pKa = 4.54PGTYY123 pKa = 10.15CLQTSSYY130 pKa = 11.61DD131 pKa = 3.82NAPLTATVRR140 pKa = 11.84IGRR143 pKa = 11.84AEE145 pKa = 4.01HH146 pKa = 6.08EE147 pKa = 4.27ALTEE151 pKa = 4.32GGATLTAAGPGDD163 pKa = 3.93TTEE166 pKa = 4.4TPAPTGASPVATDD179 pKa = 3.59TEE181 pKa = 4.63ACGGAVMLASGPLDD195 pKa = 4.13DD196 pKa = 5.77SLSQGVSRR204 pKa = 11.84TEE206 pKa = 4.02SIEE209 pKa = 4.06AVPTYY214 pKa = 10.92AFDD217 pKa = 4.17LASPASVSITAEE229 pKa = 4.01NPDD232 pKa = 4.1ADD234 pKa = 4.06PVLTLTGDD242 pKa = 3.57DD243 pKa = 3.51GTFYY247 pKa = 11.35AEE249 pKa = 3.86NDD251 pKa = 4.05DD252 pKa = 4.03YY253 pKa = 11.99DD254 pKa = 4.16GLNSRR259 pKa = 11.84IDD261 pKa = 3.47MTTPLAAGTYY271 pKa = 8.88CVQLRR276 pKa = 11.84ALSDD280 pKa = 3.01ATAPVTVSVSGFDD293 pKa = 3.65PEE295 pKa = 4.55AAAQEE300 pKa = 4.6TYY302 pKa = 11.15NRR304 pKa = 11.84GQAAPPLDD312 pKa = 3.39GSYY315 pKa = 10.78PVTDD319 pKa = 4.61LGTLSGRR326 pKa = 11.84VVTDD330 pKa = 3.32AQIQGEE336 pKa = 4.34TAQWFSVTLDD346 pKa = 3.43APGLLLVEE354 pKa = 5.55AIGAAAGGDD363 pKa = 3.4PVLRR367 pKa = 11.84VFDD370 pKa = 4.04DD371 pKa = 3.43VGRR374 pKa = 11.84EE375 pKa = 3.3IAYY378 pKa = 10.52NDD380 pKa = 5.0DD381 pKa = 3.55YY382 pKa = 11.18GQSYY386 pKa = 10.59DD387 pKa = 3.47SQIAARR393 pKa = 11.84TFPGTYY399 pKa = 10.24LIALTDD405 pKa = 3.85ISATSPLLRR414 pKa = 11.84LVIEE418 pKa = 4.7RR419 pKa = 11.84YY420 pKa = 9.97VPAEE424 pKa = 3.71
MM1 pKa = 7.14TLKK4 pKa = 10.66PLTILGALAAGTVALPASAQEE25 pKa = 4.27YY26 pKa = 10.59CGGLSSGAWIGGNEE40 pKa = 4.14ANSDD44 pKa = 3.26IGSAEE49 pKa = 4.02TFRR52 pKa = 11.84EE53 pKa = 3.82QLALVLLGNAHH64 pKa = 6.44TSLFSLSEE72 pKa = 3.95AASVRR77 pKa = 11.84LEE79 pKa = 3.91AEE81 pKa = 3.85ARR83 pKa = 11.84GQGDD87 pKa = 3.5PVIEE91 pKa = 4.19VLDD94 pKa = 4.06GEE96 pKa = 4.81GGVVATDD103 pKa = 3.87DD104 pKa = 3.95DD105 pKa = 4.44SGGGVSSAALVALEE119 pKa = 4.54PGTYY123 pKa = 10.15CLQTSSYY130 pKa = 11.61DD131 pKa = 3.82NAPLTATVRR140 pKa = 11.84IGRR143 pKa = 11.84AEE145 pKa = 4.01HH146 pKa = 6.08EE147 pKa = 4.27ALTEE151 pKa = 4.32GGATLTAAGPGDD163 pKa = 3.93TTEE166 pKa = 4.4TPAPTGASPVATDD179 pKa = 3.59TEE181 pKa = 4.63ACGGAVMLASGPLDD195 pKa = 4.13DD196 pKa = 5.77SLSQGVSRR204 pKa = 11.84TEE206 pKa = 4.02SIEE209 pKa = 4.06AVPTYY214 pKa = 10.92AFDD217 pKa = 4.17LASPASVSITAEE229 pKa = 4.01NPDD232 pKa = 4.1ADD234 pKa = 4.06PVLTLTGDD242 pKa = 3.57DD243 pKa = 3.51GTFYY247 pKa = 11.35AEE249 pKa = 3.86NDD251 pKa = 4.05DD252 pKa = 4.03YY253 pKa = 11.99DD254 pKa = 4.16GLNSRR259 pKa = 11.84IDD261 pKa = 3.47MTTPLAAGTYY271 pKa = 8.88CVQLRR276 pKa = 11.84ALSDD280 pKa = 3.01ATAPVTVSVSGFDD293 pKa = 3.65PEE295 pKa = 4.55AAAQEE300 pKa = 4.6TYY302 pKa = 11.15NRR304 pKa = 11.84GQAAPPLDD312 pKa = 3.39GSYY315 pKa = 10.78PVTDD319 pKa = 4.61LGTLSGRR326 pKa = 11.84VVTDD330 pKa = 3.32AQIQGEE336 pKa = 4.34TAQWFSVTLDD346 pKa = 3.43APGLLLVEE354 pKa = 5.55AIGAAAGGDD363 pKa = 3.4PVLRR367 pKa = 11.84VFDD370 pKa = 4.04DD371 pKa = 3.43VGRR374 pKa = 11.84EE375 pKa = 3.3IAYY378 pKa = 10.52NDD380 pKa = 5.0DD381 pKa = 3.55YY382 pKa = 11.18GQSYY386 pKa = 10.59DD387 pKa = 3.47SQIAARR393 pKa = 11.84TFPGTYY399 pKa = 10.24LIALTDD405 pKa = 3.85ISATSPLLRR414 pKa = 11.84LVIEE418 pKa = 4.7RR419 pKa = 11.84YY420 pKa = 9.97VPAEE424 pKa = 3.71
Molecular weight: 43.2 kDa
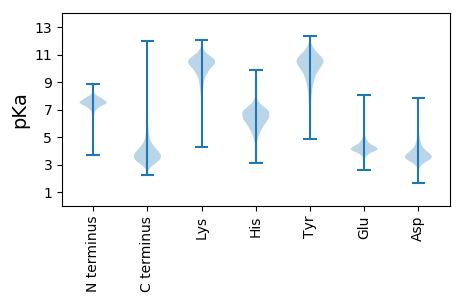
Isoelectric point according different methods:
Protein with the highest isoelectric point:
>tr|A0A5J5GR28|A0A5J5GR28_9RHOB Peptidoglycan-associated protein OS=Histidinibacterium sp. 176SS1-4 OX=2613962 GN=pal PE=3 SV=1
MM1 pKa = 7.45KK2 pKa = 9.61RR3 pKa = 11.84TFQPSNRR10 pKa = 11.84VRR12 pKa = 11.84KK13 pKa = 8.99NRR15 pKa = 11.84HH16 pKa = 3.77GFRR19 pKa = 11.84ARR21 pKa = 11.84MATKK25 pKa = 10.43GGRR28 pKa = 11.84KK29 pKa = 8.99VLNARR34 pKa = 11.84RR35 pKa = 11.84ARR37 pKa = 11.84GRR39 pKa = 11.84KK40 pKa = 9.02KK41 pKa = 10.61LSAA44 pKa = 4.03
MM1 pKa = 7.45KK2 pKa = 9.61RR3 pKa = 11.84TFQPSNRR10 pKa = 11.84VRR12 pKa = 11.84KK13 pKa = 8.99NRR15 pKa = 11.84HH16 pKa = 3.77GFRR19 pKa = 11.84ARR21 pKa = 11.84MATKK25 pKa = 10.43GGRR28 pKa = 11.84KK29 pKa = 8.99VLNARR34 pKa = 11.84RR35 pKa = 11.84ARR37 pKa = 11.84GRR39 pKa = 11.84KK40 pKa = 9.02KK41 pKa = 10.61LSAA44 pKa = 4.03
Molecular weight: 5.15 kDa
Isoelectric point according different methods:
Peptides (in silico digests for buttom-up proteomics)
Below you can find in silico digests of the whole proteome with Trypsin, Chymotrypsin, Trypsin+LysC, LysN, ArgC proteases suitable for different mass spec machines.| Try ESI |
 |
|---|
| ChTry ESI |
 |
|---|
| ArgC ESI |
 |
|---|
| LysN ESI |
 |
|---|
| TryLysC ESI |
 |
|---|
| Try MALDI |
 |
|---|
| ChTry MALDI |
 |
|---|
| ArgC MALDI |
 |
|---|
| LysN MALDI |
 |
|---|
| TryLysC MALDI |
 |
|---|
| Try LTQ |
 |
|---|
| ChTry LTQ |
 |
|---|
| ArgC LTQ |
 |
|---|
| LysN LTQ |
 |
|---|
| TryLysC LTQ |
 |
|---|
| Try MSlow |
 |
|---|
| ChTry MSlow |
 |
|---|
| ArgC MSlow |
 |
|---|
| LysN MSlow |
 |
|---|
| TryLysC MSlow |
 |
|---|
| Try MShigh |
 |
|---|
| ChTry MShigh |
 |
|---|
| ArgC MShigh |
 |
|---|
| LysN MShigh |
 |
|---|
| TryLysC MShigh |
 |
|---|
General Statistics
Number of major isoforms |
Number of additional isoforms |
Number of all proteins |
Number of amino acids |
Min. Seq. Length |
Max. Seq. Length |
Avg. Seq. Length |
Avg. Mol. Weight |
|---|---|---|---|---|---|---|---|
0 |
1173173 |
28 |
8883 |
312.1 |
33.86 |
Amino acid frequency
Ala |
Cys |
Asp |
Glu |
Phe |
Gly |
His |
Ile |
Lys |
Leu |
|---|---|---|---|---|---|---|---|---|---|
12.304 ± 0.056 | 0.823 ± 0.015 |
5.934 ± 0.044 | 6.965 ± 0.048 |
3.516 ± 0.03 | 9.041 ± 0.049 |
1.946 ± 0.023 | 4.705 ± 0.03 |
2.458 ± 0.033 | 10.258 ± 0.056 |
Met |
Asn |
Gln |
Pro |
Arg |
Ser |
Thr |
Val |
Trp |
Tyr |
|---|---|---|---|---|---|---|---|---|---|
2.546 ± 0.022 | 2.153 ± 0.022 |
5.343 ± 0.041 | 2.86 ± 0.023 |
7.492 ± 0.05 | 5.162 ± 0.031 |
5.444 ± 0.036 | 7.465 ± 0.034 |
1.456 ± 0.017 | 2.131 ± 0.018 |
Most of the basic statistics you can see at this page can be downloaded from this CSV file
Proteome-pI is available under Creative Commons Attribution-NoDerivs license, for more details see here
| Reference: Kozlowski LP. Proteome-pI 2.0: Proteome Isoelectric Point Database Update. Nucleic Acids Res. 2021, doi: 10.1093/nar/gkab944 | Contact: Lukasz P. Kozlowski |
