Chryseobacterium hominis
Taxonomy: cellular organisms; Bacteria; FCB group; Bacteroidetes/Chlorobi group; Bacteroidetes; Flavobacteriia; Flavobacteriales; Weeksellaceae; Chryseobacterium group; Epilithonimonas
Average proteome isoelectric point is 6.68
Get precalculated fractions of proteins
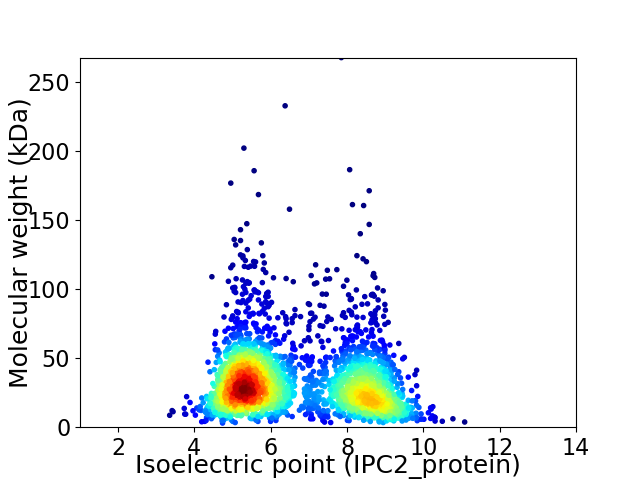
Virtual 2D-PAGE plot for 2619 proteins (isoelectric point calculated using IPC2_protein)
Get csv file with sequences according to given criteria:
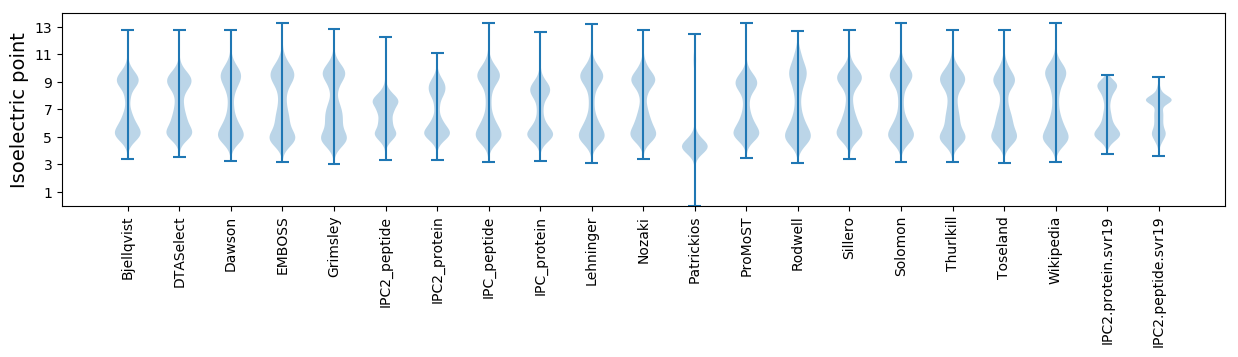
* You can choose from 21 different methods for calculating isoelectric point
Summary statistics related to proteome-wise predictions
Protein with the lowest isoelectric point:
>tr|A0A1H6HL82|A0A1H6HL82_9FLAO Membrane fusion protein multidrug efflux system OS=Chryseobacterium hominis OX=420404 GN=SAMN05421793_10126 PE=4 SV=1
MM1 pKa = 7.81DD2 pKa = 3.9VDD4 pKa = 3.4IDD6 pKa = 4.11GTIDD10 pKa = 4.6LYY12 pKa = 11.4DD13 pKa = 4.29KK14 pKa = 11.14YY15 pKa = 10.3VTLPGPVEE23 pKa = 4.43NNGCPLSNNGNGVVSADD40 pKa = 3.45EE41 pKa = 4.06TVMNGIEE48 pKa = 4.16FDD50 pKa = 4.21LNSDD54 pKa = 4.15RR55 pKa = 11.84IKK57 pKa = 10.96PNNTPIFNSAISYY70 pKa = 10.1INSNNGSYY78 pKa = 10.56EE79 pKa = 4.32LIGATDD85 pKa = 3.47TRR87 pKa = 11.84GSS89 pKa = 3.41
MM1 pKa = 7.81DD2 pKa = 3.9VDD4 pKa = 3.4IDD6 pKa = 4.11GTIDD10 pKa = 4.6LYY12 pKa = 11.4DD13 pKa = 4.29KK14 pKa = 11.14YY15 pKa = 10.3VTLPGPVEE23 pKa = 4.43NNGCPLSNNGNGVVSADD40 pKa = 3.45EE41 pKa = 4.06TVMNGIEE48 pKa = 4.16FDD50 pKa = 4.21LNSDD54 pKa = 4.15RR55 pKa = 11.84IKK57 pKa = 10.96PNNTPIFNSAISYY70 pKa = 10.1INSNNGSYY78 pKa = 10.56EE79 pKa = 4.32LIGATDD85 pKa = 3.47TRR87 pKa = 11.84GSS89 pKa = 3.41
Molecular weight: 9.52 kDa
Isoelectric point according different methods:
Protein with the highest isoelectric point:
>tr|A0A1H6J056|A0A1H6J056_9FLAO UvrABC system protein C OS=Chryseobacterium hominis OX=420404 GN=uvrC PE=3 SV=1
MM1 pKa = 7.84PSGKK5 pKa = 9.32KK6 pKa = 9.59RR7 pKa = 11.84KK8 pKa = 7.05RR9 pKa = 11.84HH10 pKa = 5.11KK11 pKa = 10.59VATHH15 pKa = 5.21KK16 pKa = 10.3RR17 pKa = 11.84KK18 pKa = 9.62KK19 pKa = 9.04RR20 pKa = 11.84RR21 pKa = 11.84RR22 pKa = 11.84ANRR25 pKa = 11.84HH26 pKa = 4.77KK27 pKa = 10.58KK28 pKa = 9.8KK29 pKa = 10.51KK30 pKa = 10.04
MM1 pKa = 7.84PSGKK5 pKa = 9.32KK6 pKa = 9.59RR7 pKa = 11.84KK8 pKa = 7.05RR9 pKa = 11.84HH10 pKa = 5.11KK11 pKa = 10.59VATHH15 pKa = 5.21KK16 pKa = 10.3RR17 pKa = 11.84KK18 pKa = 9.62KK19 pKa = 9.04RR20 pKa = 11.84RR21 pKa = 11.84RR22 pKa = 11.84ANRR25 pKa = 11.84HH26 pKa = 4.77KK27 pKa = 10.58KK28 pKa = 9.8KK29 pKa = 10.51KK30 pKa = 10.04
Molecular weight: 3.76 kDa
Isoelectric point according different methods:
Peptides (in silico digests for buttom-up proteomics)
Below you can find in silico digests of the whole proteome with Trypsin, Chymotrypsin, Trypsin+LysC, LysN, ArgC proteases suitable for different mass spec machines.| Try ESI |
 |
|---|
| ChTry ESI |
|
|---|
| ArgC ESI |
|
|---|
| LysN ESI |
|
|---|
| TryLysC ESI |
|
|---|
| Try MALDI |
|
|---|
| ChTry MALDI |
|
|---|
| ArgC MALDI |
|
|---|
| LysN MALDI |
|
|---|
| TryLysC MALDI |
|
|---|
| Try LTQ |
|
|---|
| ChTry LTQ |
|
|---|
| ArgC LTQ |
|
|---|
| LysN LTQ |
|
|---|
| TryLysC LTQ |
|
|---|
| Try MSlow |
|
|---|
| ChTry MSlow |
|
|---|
| ArgC MSlow |
|
|---|
| LysN MSlow |
|
|---|
| TryLysC MSlow |
|
|---|
| Try MShigh |
|
|---|
| ChTry MShigh |
|
|---|
| ArgC MShigh |
|
|---|
| LysN MShigh |
|
|---|
| TryLysC MShigh |
|
|---|
General Statistics
Number of major isoforms |
Number of additional isoforms |
Number of all proteins |
Number of amino acids |
Min. Seq. Length |
Max. Seq. Length |
Avg. Seq. Length |
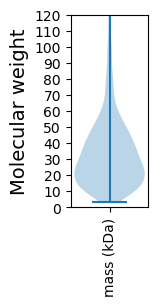
Avg. Mol. Weight |
|---|---|---|---|---|---|---|---|
0 |
818176 |
25 |
2365 |
312.4 |
35.39 |
Amino acid frequency
Ala |
Cys |
Asp |
Glu |
Phe |
Gly |
His |
Ile |
Lys |
Leu |
|---|---|---|---|---|---|---|---|---|---|
6.19 ± 0.049 | 0.727 ± 0.015 |
5.535 ± 0.036 | 6.786 ± 0.064 |
5.486 ± 0.042 | 6.217 ± 0.045 |
1.64 ± 0.021 | 8.064 ± 0.051 |
8.501 ± 0.048 | 9.126 ± 0.048 |
Met |
Asn |
Gln |
Pro |
Arg |
Ser |
Thr |
Val |
Trp |
Tyr |
|---|---|---|---|---|---|---|---|---|---|
2.303 ± 0.022 | 6.305 ± 0.051 |
3.382 ± 0.024 | 3.56 ± 0.034 |
3.356 ± 0.029 | 6.505 ± 0.037 |
5.258 ± 0.043 | 6.013 ± 0.035 |
1.012 ± 0.017 | 4.035 ± 0.032 |
Most of the basic statistics you can see at this page can be downloaded from this CSV file
See this proteome in:

Proteome-pI is available under Creative Commons Attribution-NoDerivs license, for more details see here
| Reference: Kozlowski LP. Proteome-pI 2.0: Proteome Isoelectric Point Database Update. Nucleic Acids Res. 2021, doi: 10.1093/nar/gkab944 | Contact: Lukasz P. Kozlowski |